
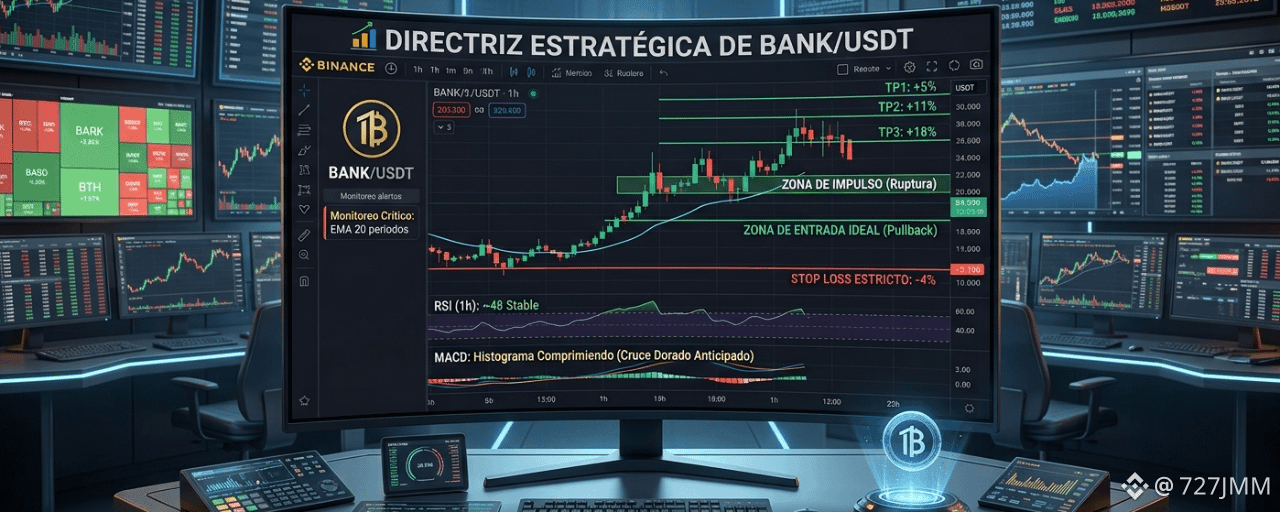
BANK/USDT within the Binance ecosystem prioritizes strict capital management and liquidity flow readouts.
1. Trend and Oscillators
Trend: High (Bullish). The asset is in a structural consolidation phase, absorbing selling pressure before its next breakout.
RSI (1h): Stabilizing pivot near the 48 mark. It has already cleared the overbought zones, leaving the path completely open for a new aggressive impulse.
MACD: The histogram is compressing residual bearish momentum, anticipating an imminent institutional golden cross under the zero line.
2. Critical Monitoring: 20-Period EMA
15m Chart: In microstructure, we need the price to recover and validate the 20 EMA as a dynamic support springboard.
1h Chart: This is your vital risk boundary. Losing the 20 EMA on 1h (marked by the close of a candle with sell-side volume below the indicator) completely invalidates the bullish structure and forces you to abort the trade.
3. Strategic Trading Levels
Ideal Entry Zone: At the base of the recent technical pullback, waiting for confirmation of rejection to the downside.
Impulse Zone: The immediate local resistance. Its breakout with volume will trigger the market’s FOMO.
TP1 (Quick Take): +5%. When you hit this target, secure 30% of your capital and automatically adjust your Stop Loss to breakeven.
TP2 (Swing): +11%. Major resistance level. Here you take an additional 40% in gains.
TP3 (Moon bag): +18%. Speculative Fibonacci extension target reserved for the remaining 30% of the position.
Strict Stop Loss: -4%. Placed strategically below the most recent intraday technical low and protected by the 1h 20 EMA.