
WZ Crypto
1.4k Posts

WZ Crypto
Crypto Market Strategist 📉 Asymmetry, Flow & Market Cycles 🐳 Whale Behavior Analysis 📊 Deep Analysis. Smart Execution.
Frequent Trader
2.9 Years
13 Following
849 Followers
5.9K+ Liked
Posts
All
Quotes
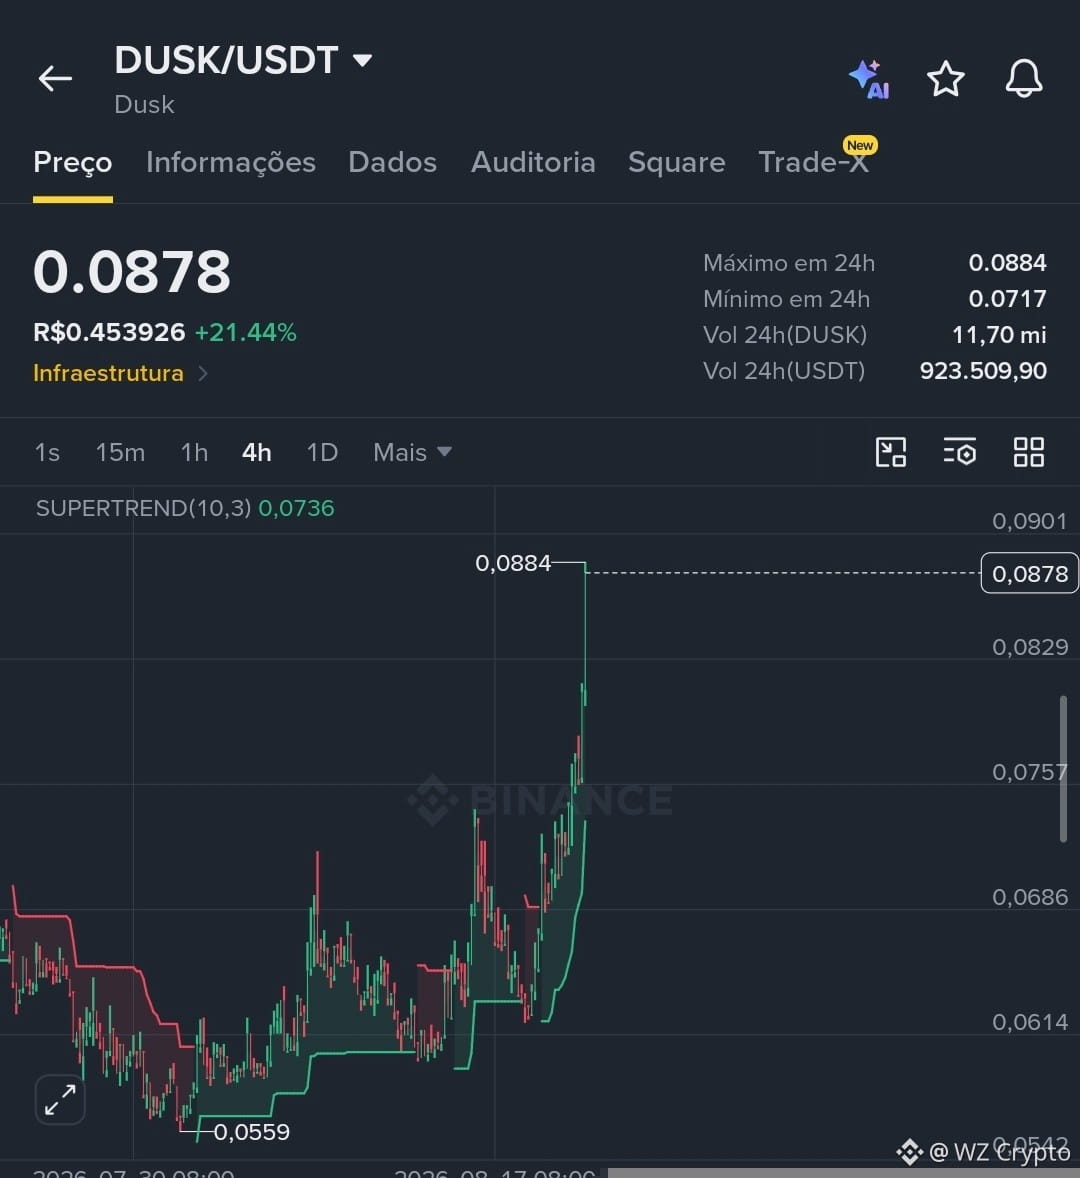
$ENA wanting to go to the moon with more than 7 billion in market cap, I hope good things come from this project ...
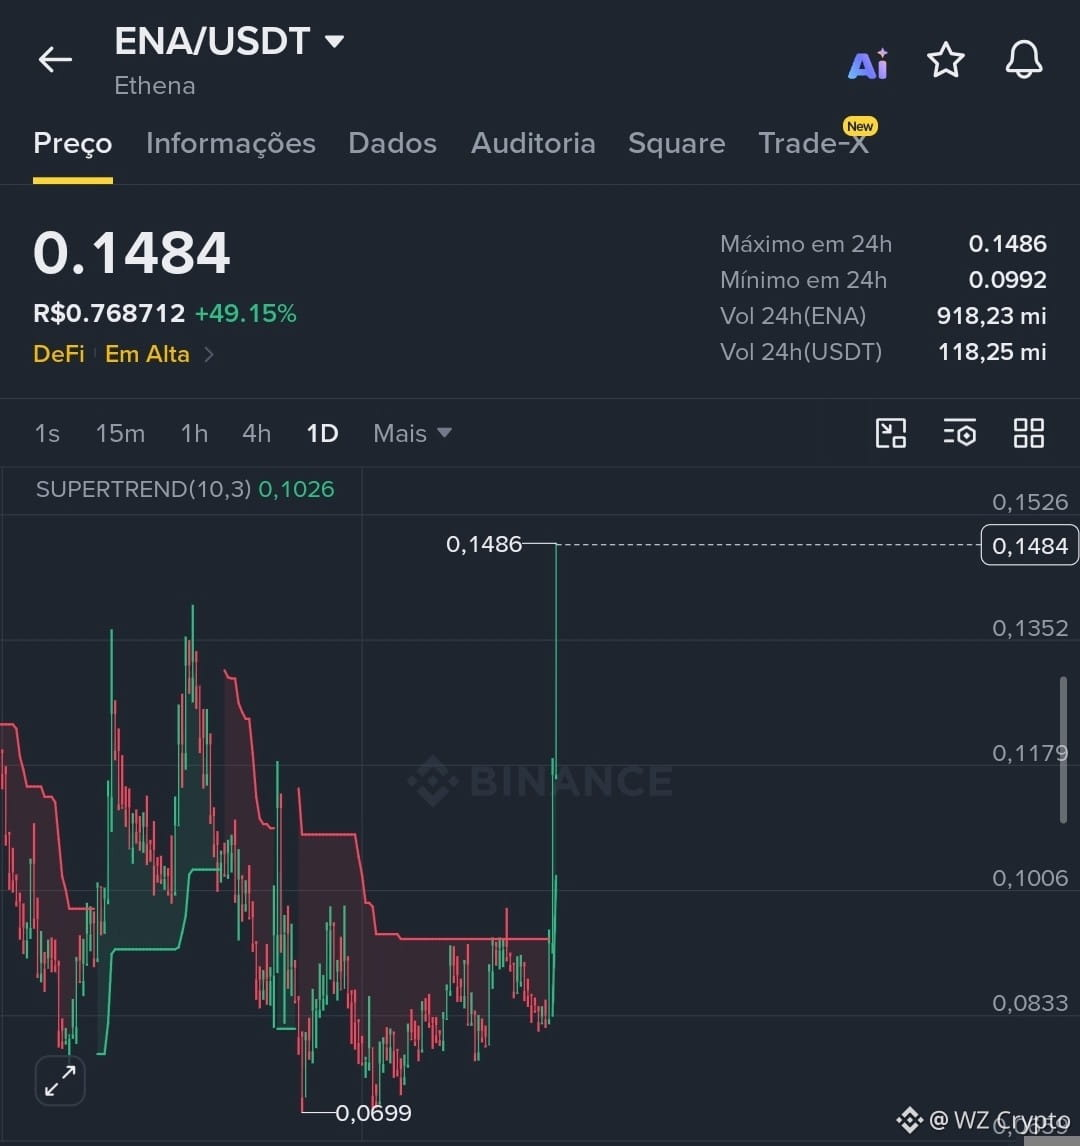
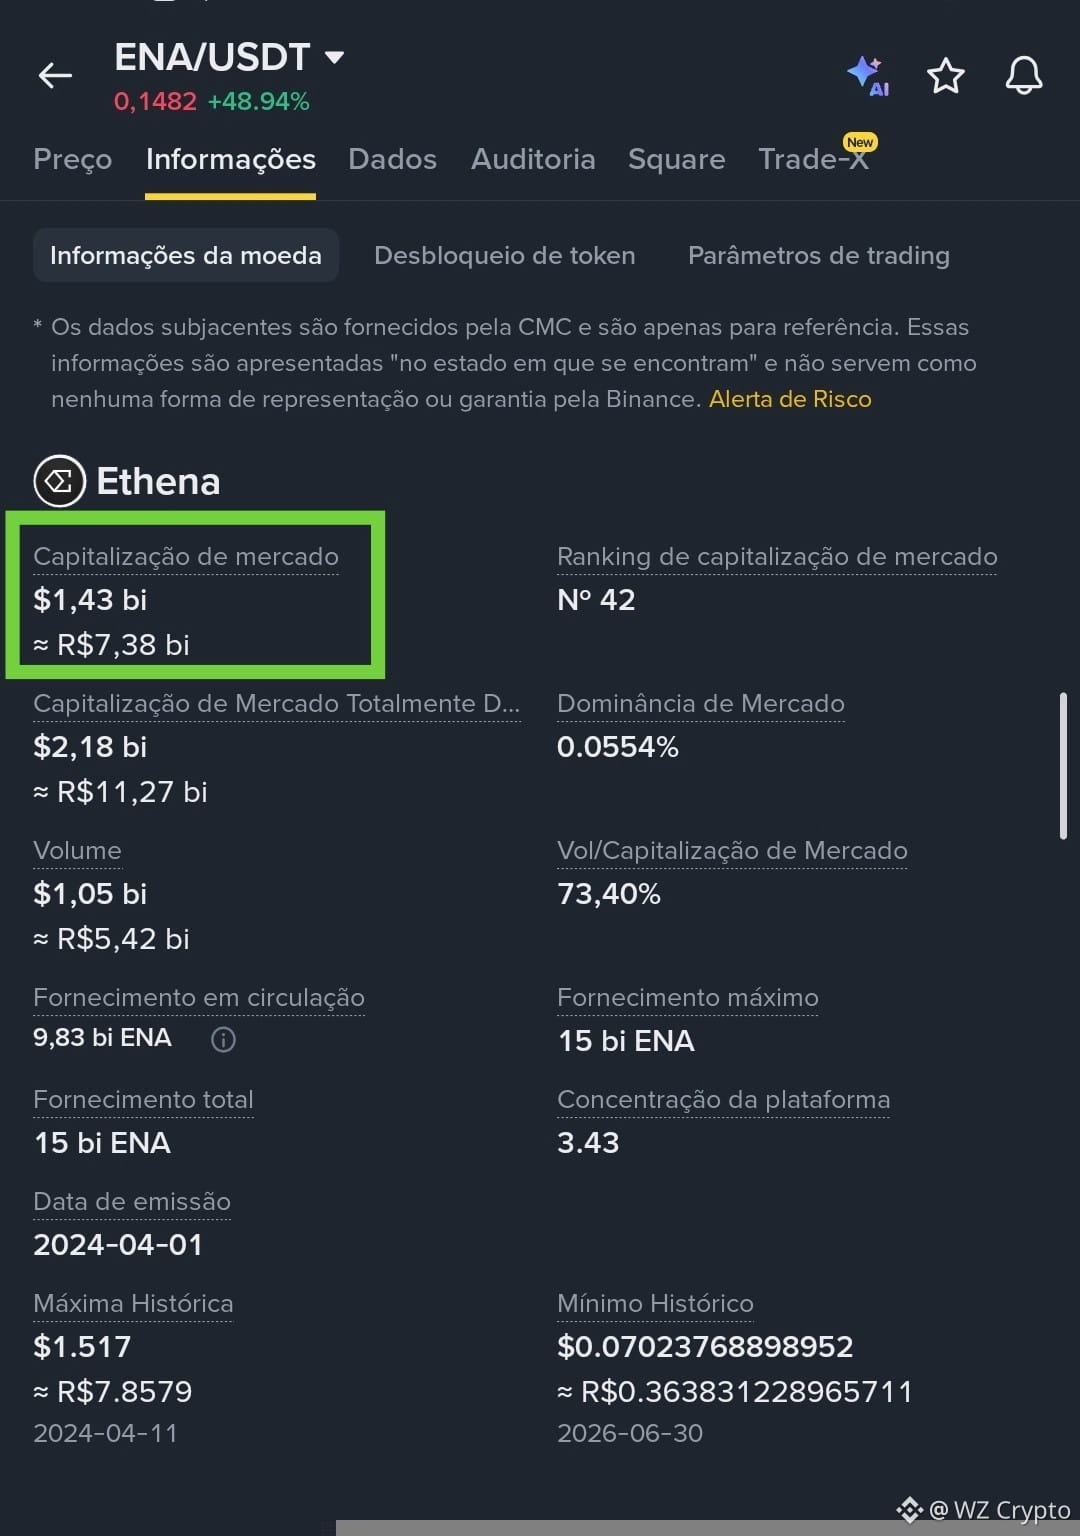
🚀 Something big seems to be getting built here… 👀
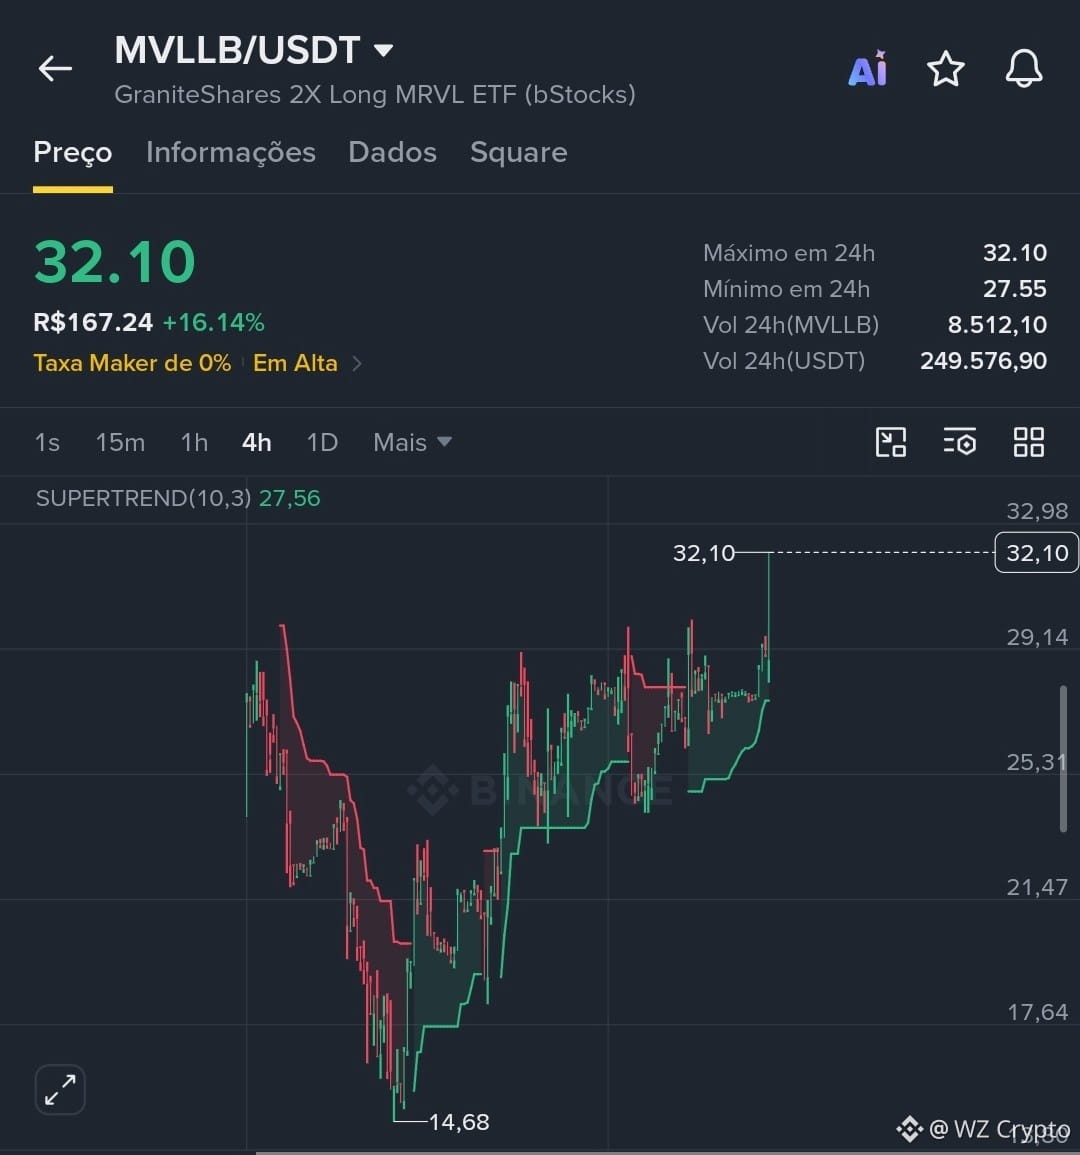
$MVLLB is already at 32.10, with +16% in the last 24h and the Supertrend pointing up 📈🔥
📍 Support: 27.55 – 29.14
🎯 Targets: 32.98 / 35.00+
If it keeps holding this zone, we may be seeing only the beginning of this move. 👀🚀
Who’s following this chart? 📊
$MVLLB is already at 32.10, with +16% in the last 24h and the Supertrend pointing up 📈🔥
📍 Support: 27.55 – 29.14
🎯 Targets: 32.98 / 35.00+
If it keeps holding this zone, we may be seeing only the beginning of this move. 👀🚀
Who’s following this chart? 📊
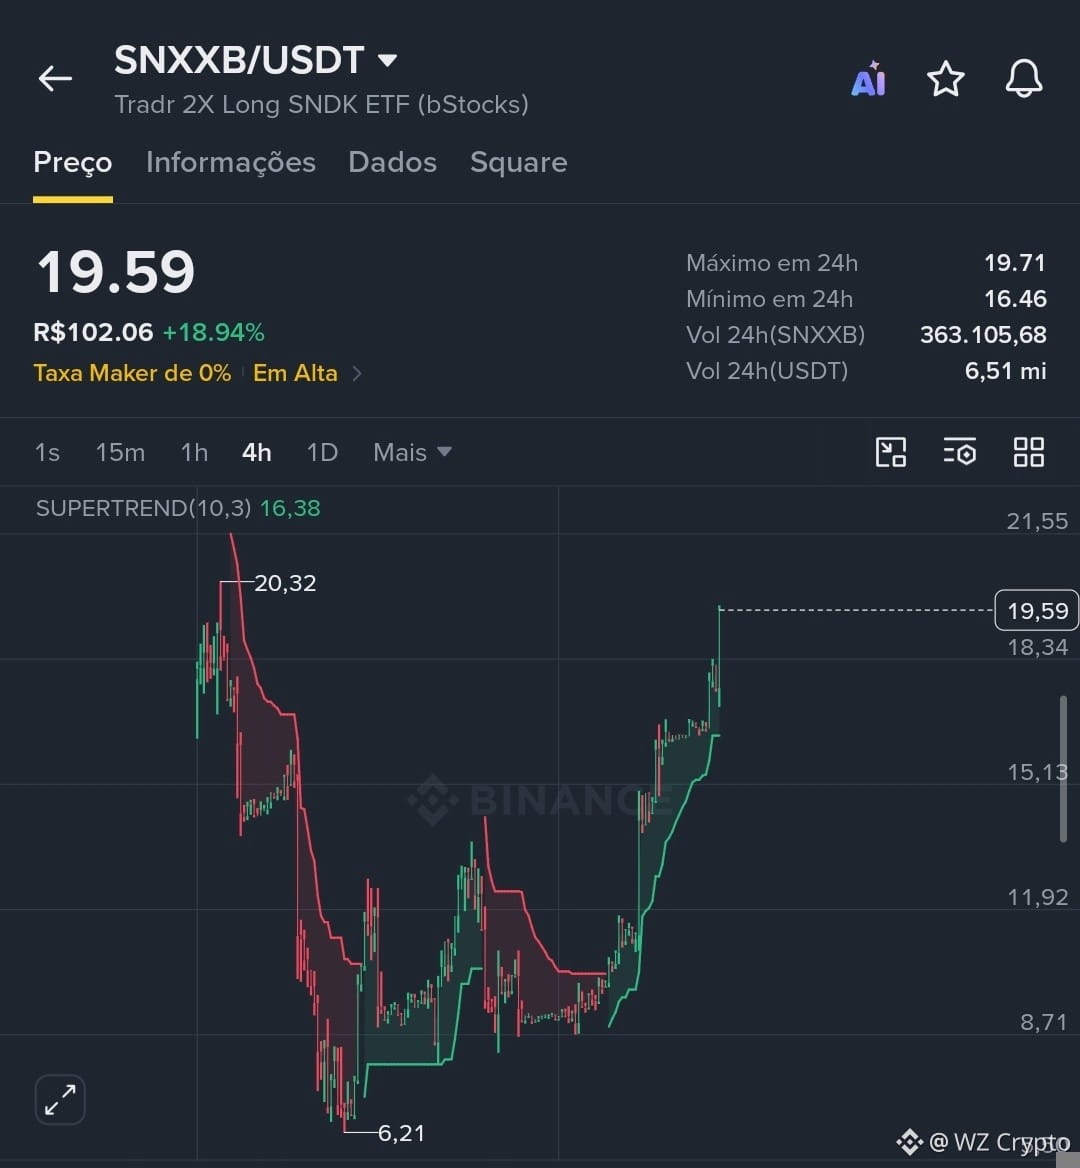
🚀 $SNXXB took a big breath!
After coming out of US$6.21, the asset reached US$19.59, showing a strong recovery on the 4H chart.
📍 Entry: US$17.50–19.00
🎯 Targets: US$20.32 → US$22 → US$25
🔥 Supertrend remains bullish. Now, watch for a break above US$20.32.
After coming out of US$6.21, the asset reached US$19.59, showing a strong recovery on the 4H chart.
📍 Entry: US$17.50–19.00
🎯 Targets: US$20.32 → US$22 → US$25
🔥 Supertrend remains bullish. Now, watch for a break above US$20.32.
when you spent the August salary but it's still August

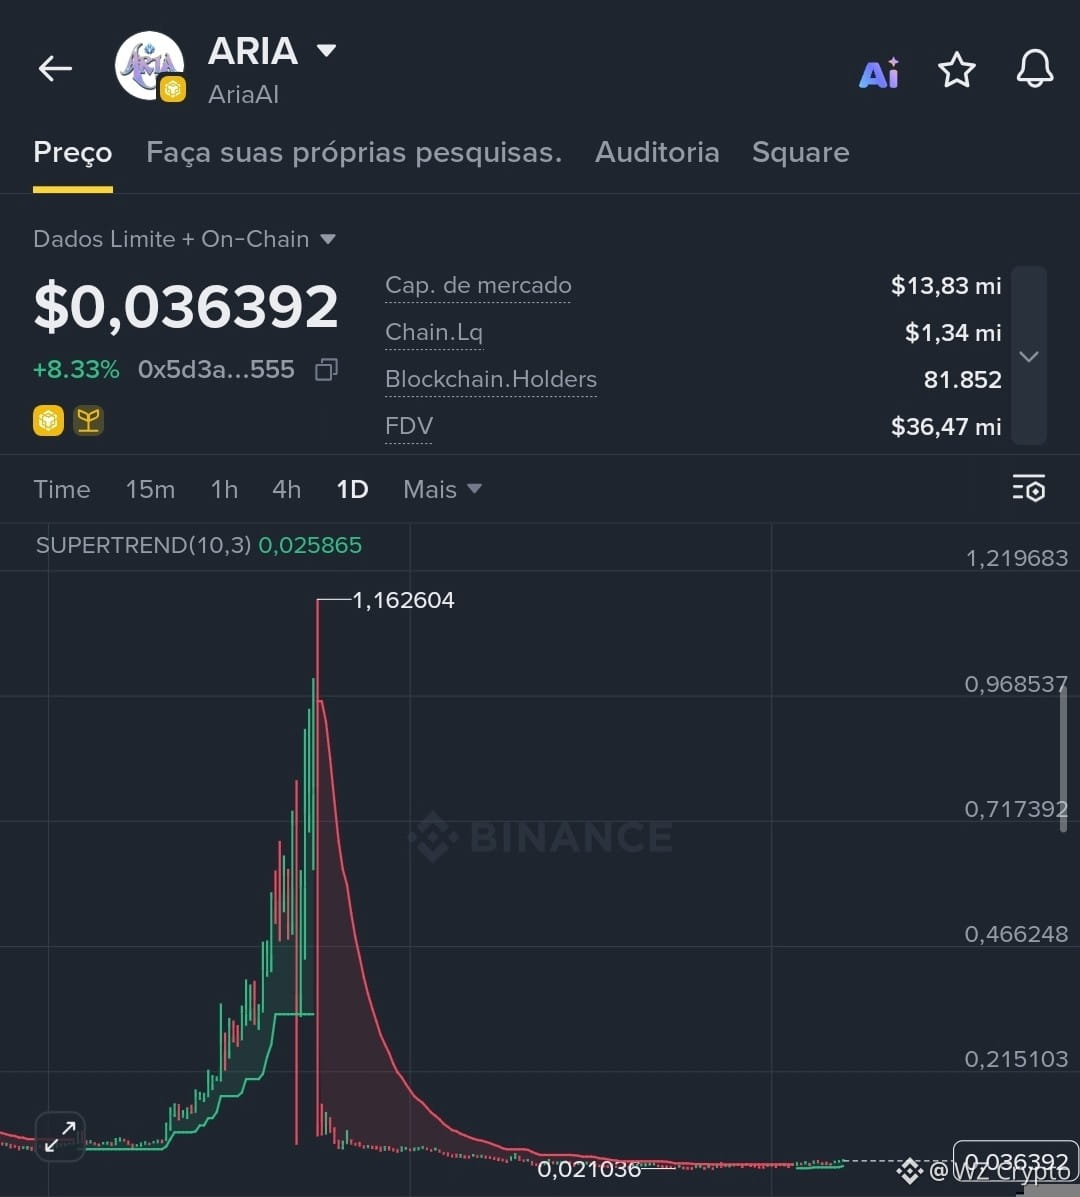
$ARIA trying to build a fund!
After a sharp drop, the price starts to show a reaction and the Supertrend has turned positive. Now, the US$0.030 region is important to support the move.
📍 Entry: US$0.030–US$0.037
🎯 Targets: US$0.050 → US$0.068 → US$0.10
🔥 If it gains volume, you can look for a gradual recovery.
After a sharp drop, the price starts to show a reaction and the Supertrend has turned positive. Now, the US$0.030 region is important to support the move.
📍 Entry: US$0.030–US$0.037
🎯 Targets: US$0.050 → US$0.068 → US$0.10
🔥 If it gains volume, you can look for a gradual recovery.
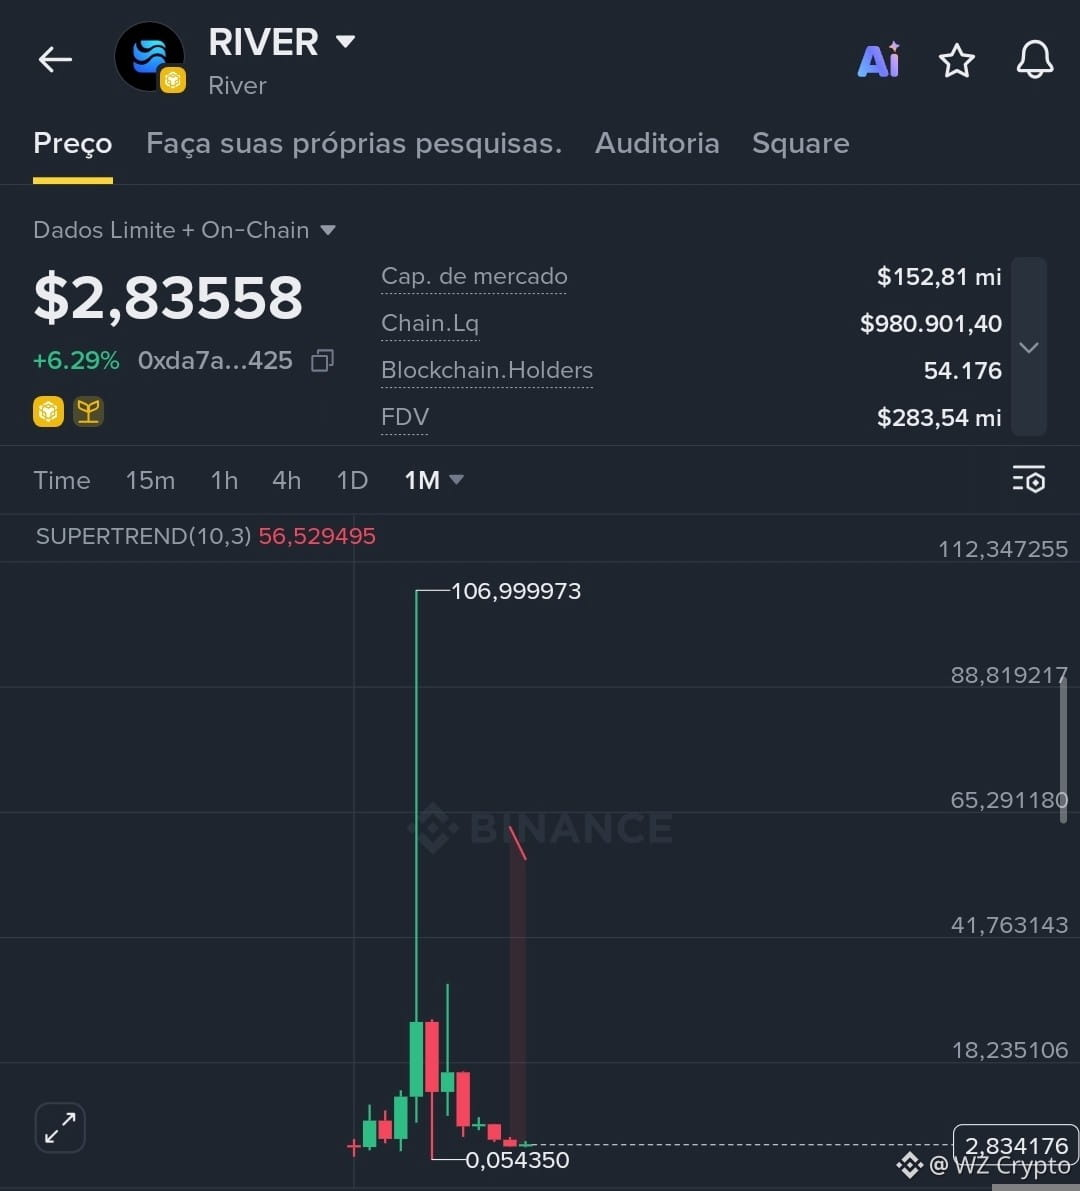
$RIVER showing reaction!
After a strong correction, RIVER starts to regain strength on the monthly chart. It still needs to confirm the reversal, but the current area deserves attention.
📍 Entry: US$2.50–2.80
🎯 Targets: US$4 → US$6 → US$10
If it breaks above US$4, the outlook becomes more positive. 🚀
After a strong correction, RIVER starts to regain strength on the monthly chart. It still needs to confirm the reversal, but the current area deserves attention.
📍 Entry: US$2.50–2.80
🎯 Targets: US$4 → US$6 → US$10
If it breaks above US$4, the outlook becomes more positive. 🚀
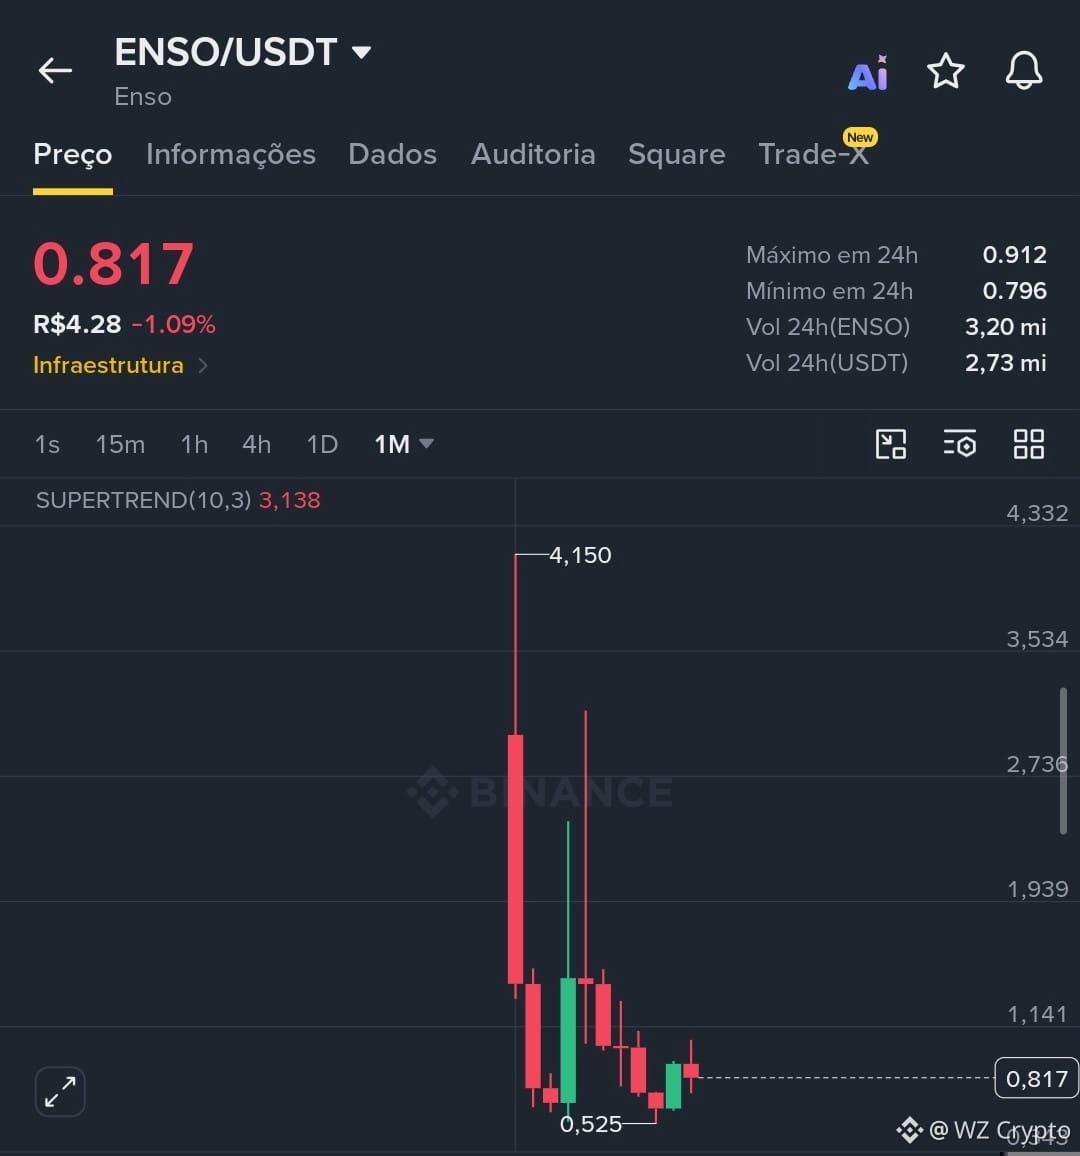
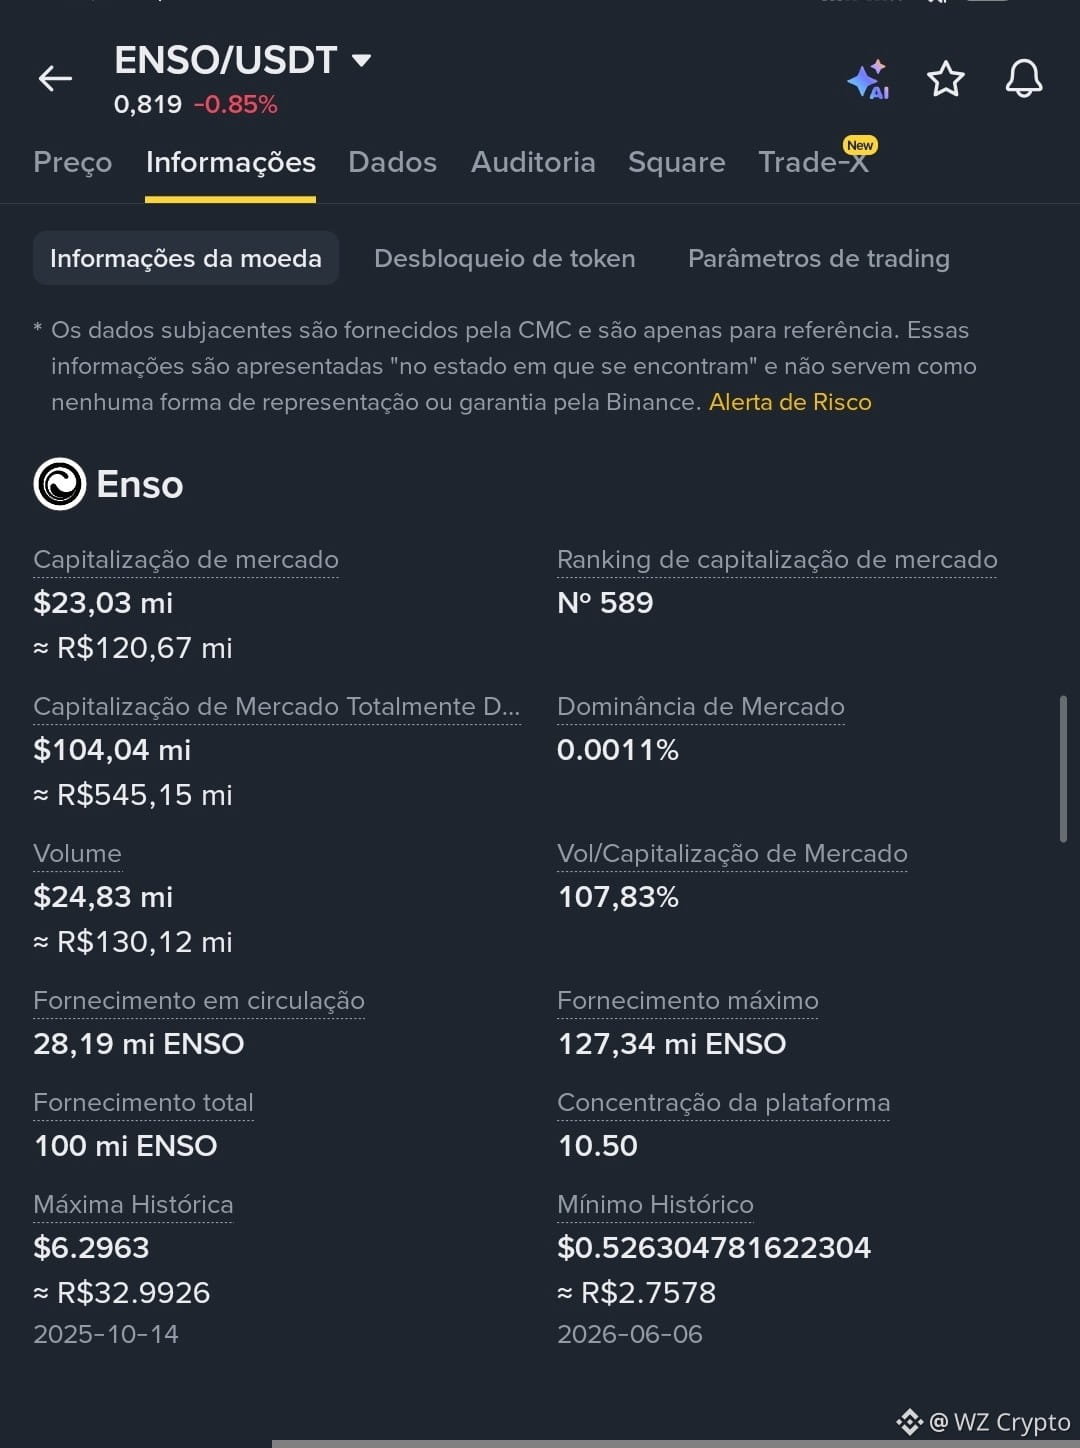
$ENSO is at the bottom? 👀
The price found support at $0.525 and is beginning to show a reaction. This could be the start of an accumulation phase, but a reversal still needs confirmation.
📍 Entry: $0.70–0.85
🎯 Targets: $1.14 → $1.50 → $1.94
🔥 Breaking above $1.14 makes the scenario much more interesting.
⚠️ If it loses $0.525, it may seek a new bottom.
The price found support at $0.525 and is beginning to show a reaction. This could be the start of an accumulation phase, but a reversal still needs confirmation.
📍 Entry: $0.70–0.85
🎯 Targets: $1.14 → $1.50 → $1.94
🔥 Breaking above $1.14 makes the scenario much more interesting.
⚠️ If it loses $0.525, it may seek a new bottom.
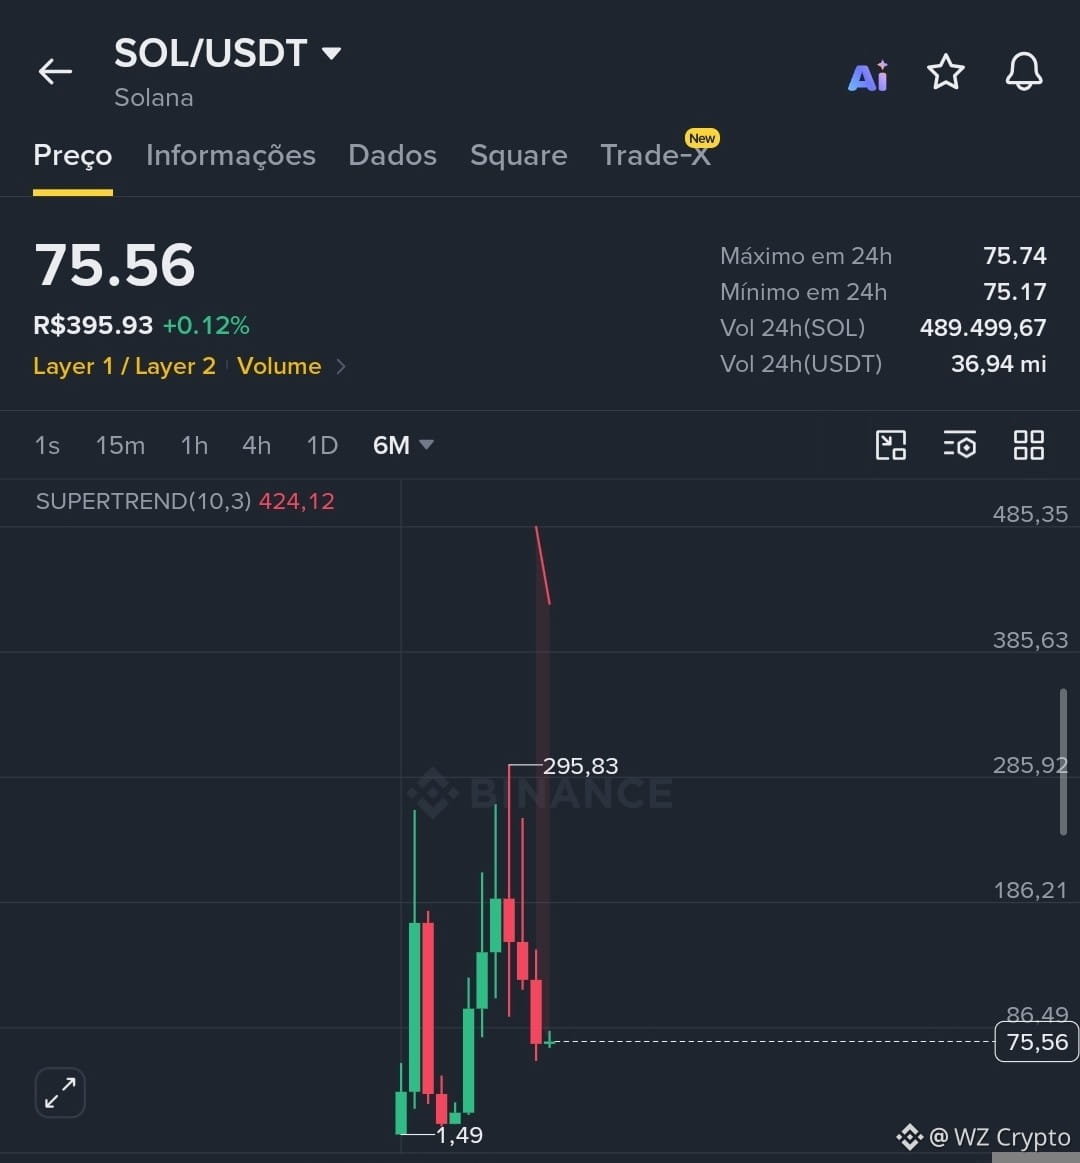
$SOL : wait or opportunity?
SOL fell hard, but it reached an important region. 👀
The reaction around US$70–75 could be the start of a new uptrend.
📍 Entry: US$70–78
🎯 Targets: US$90 → US$100 → US$130 → US$186
🔥 If it recovers US$90 strongly, the scenario begins to change.
It doesn’t look like a one-way road… it may just be a pause before the next rally. 🚀
SOL fell hard, but it reached an important region. 👀
The reaction around US$70–75 could be the start of a new uptrend.
📍 Entry: US$70–78
🎯 Targets: US$90 → US$100 → US$130 → US$186
🔥 If it recovers US$90 strongly, the scenario begins to change.
It doesn’t look like a one-way road… it may just be a pause before the next rally. 🚀

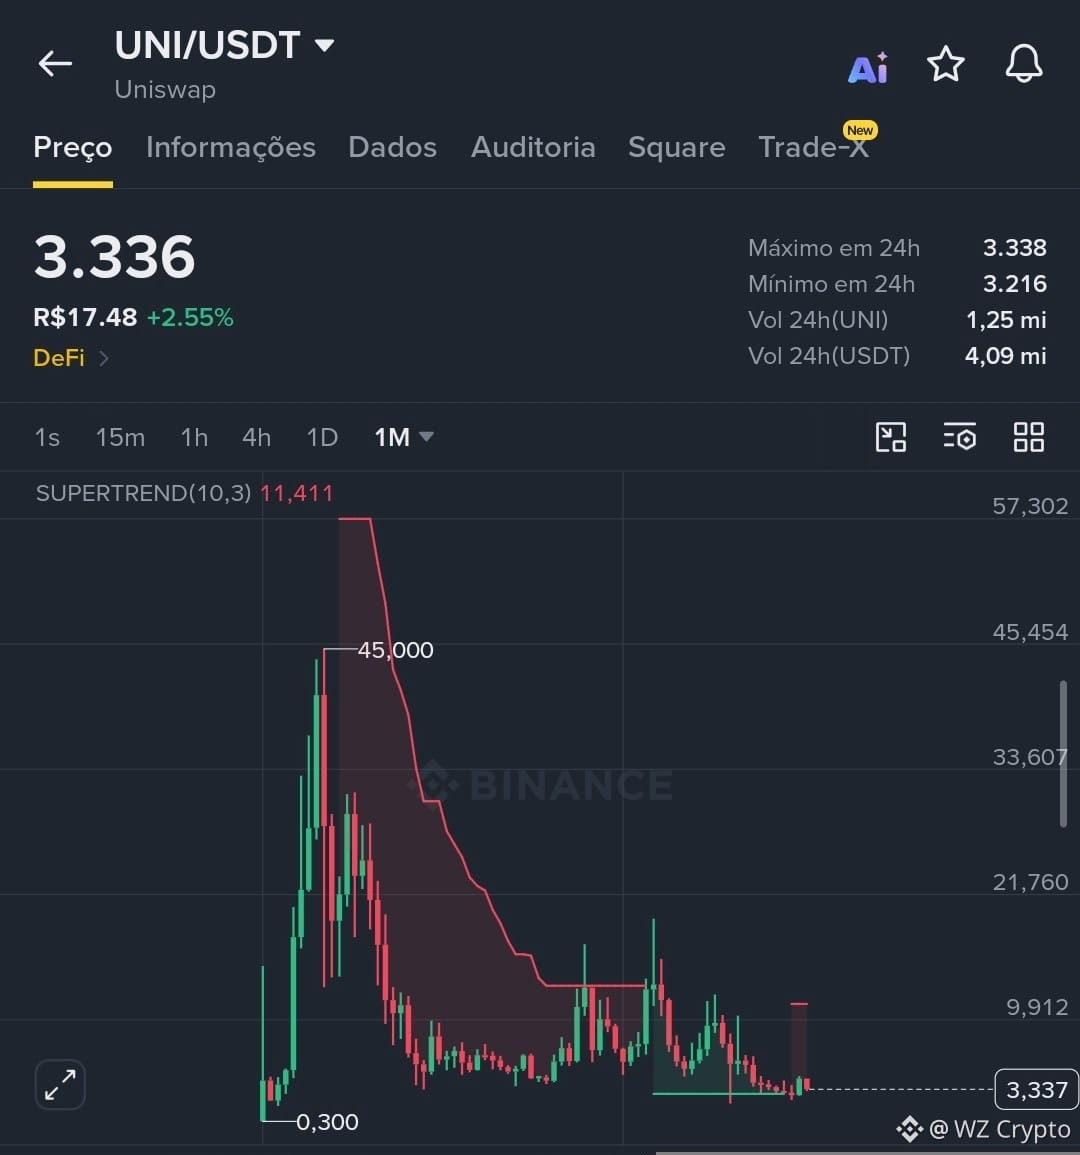
🚀 $UNI may be preparing a new story!
After a huge drop, UNI has returned to a region that could attract new buyers. And we can't forget: the asset has already reached US$45+ in the past. 👀
📍 Entry: $3,20–3,50
🎯 Targets: $4,50 → $6 → $9,90 → $11–12
If the reversal gains momentum, could we be looking at a big recovery?
After a huge drop, UNI has returned to a region that could attract new buyers. And we can't forget: the asset has already reached US$45+ in the past. 👀
📍 Entry: $3,20–3,50
🎯 Targets: $4,50 → $6 → $9,90 → $11–12
If the reversal gains momentum, could we be looking at a big recovery?
This guy will be successful one day

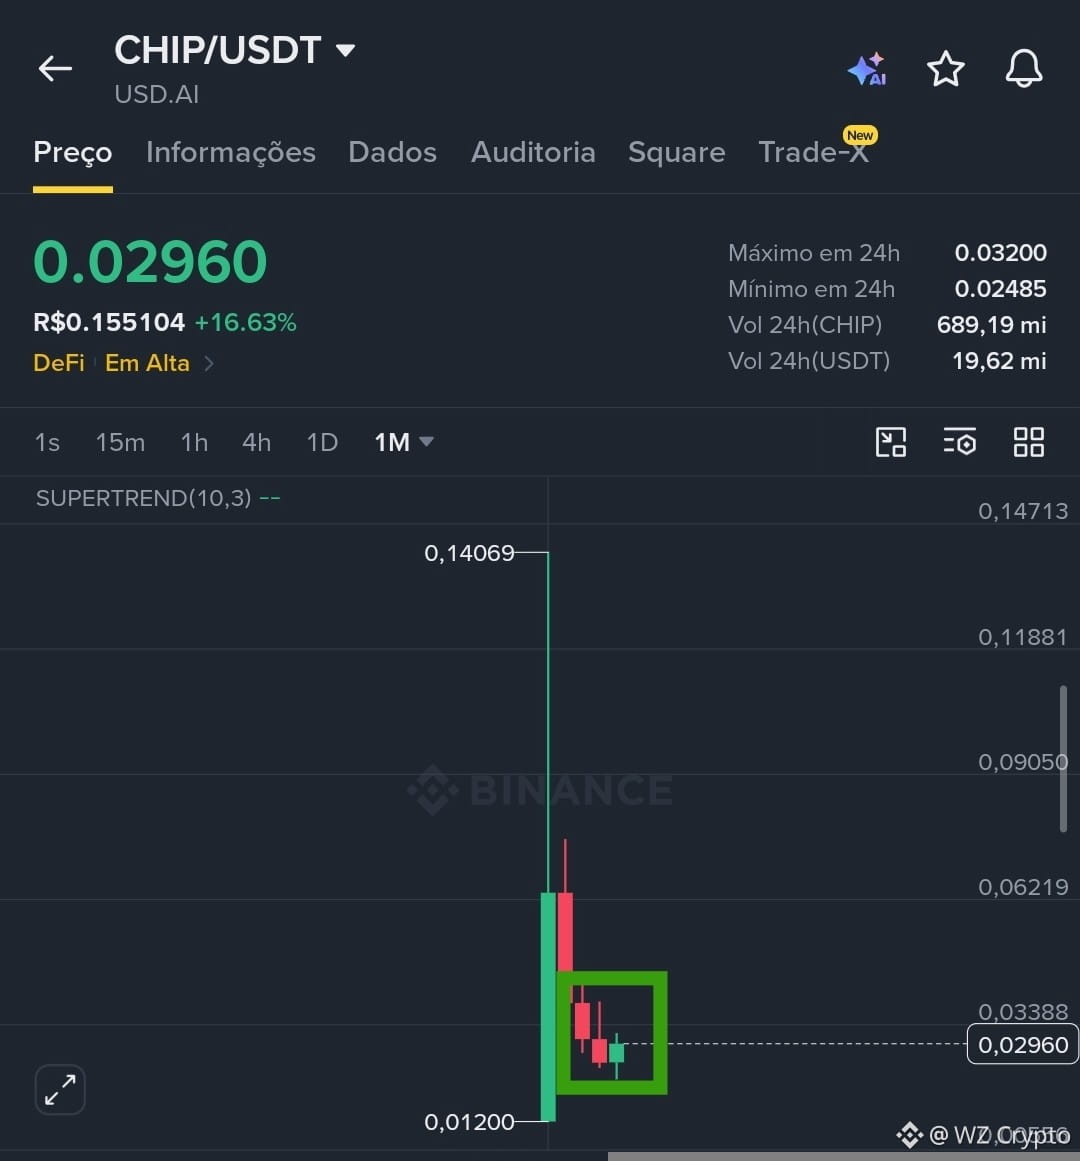
🚀$CHIP showing strength in the month!
After weeks of decline, a green candle appears with a buying reaction. If it holds above 0.030, you may seek new resistance levels.
📍 Entry: 0.028–0.030
🎯 Targets: 0.034 → 0.050 → 0.062
⚠️ Monthly close confirmation is important.
After weeks of decline, a green candle appears with a buying reaction. If it holds above 0.030, you may seek new resistance levels.
📍 Entry: 0.028–0.030
🎯 Targets: 0.034 → 0.050 → 0.062
⚠️ Monthly close confirmation is important.
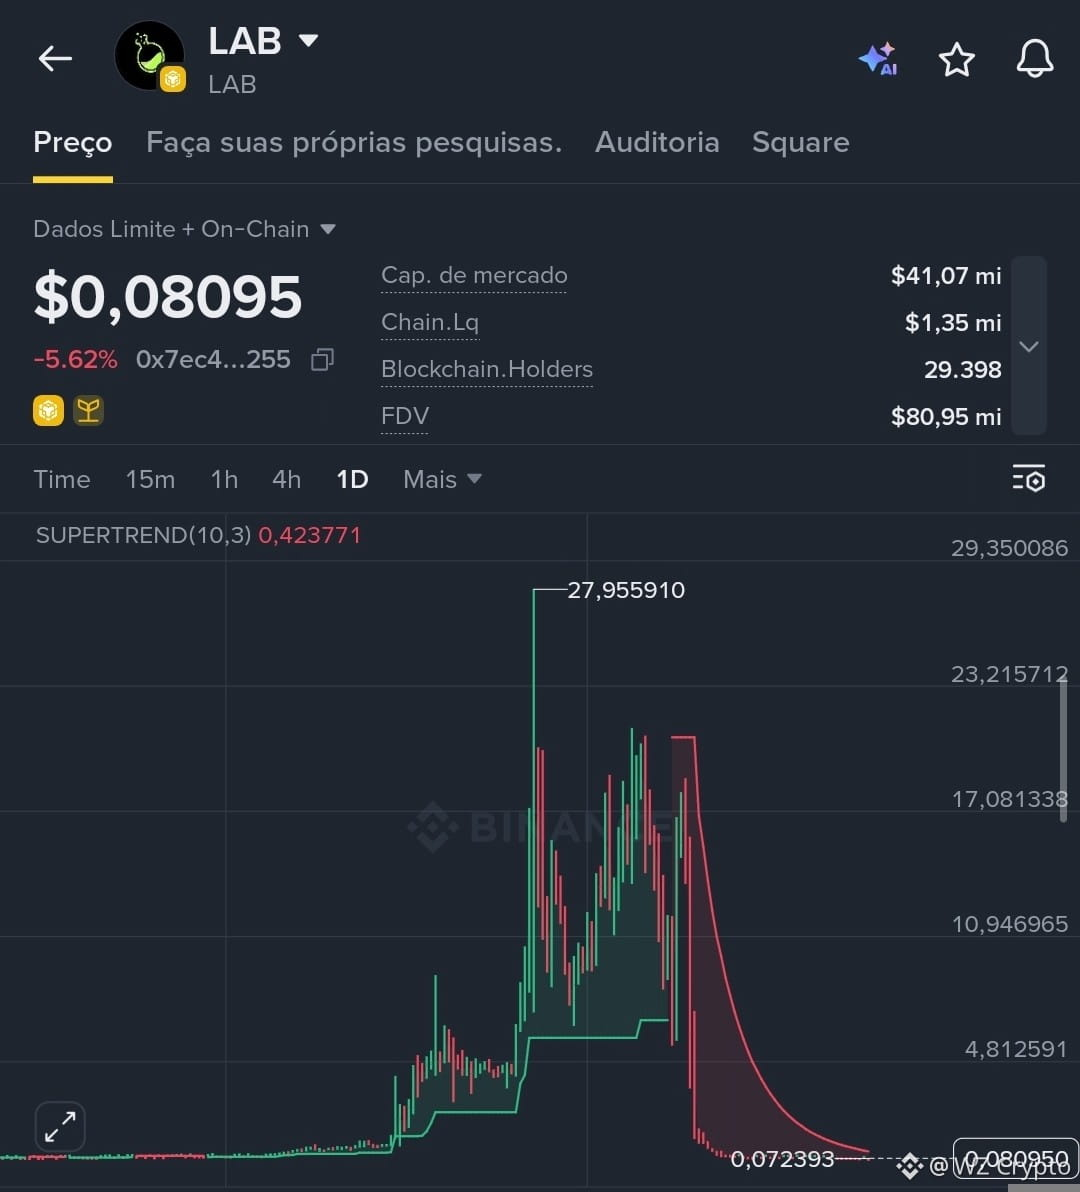
$LAB is in a region that deserves attention. 👀
The price is very close to the historical low around $0.074, but we still don’t have confirmation of a bottom.
📍 Area of interest: $0.074–$0.080
🎯 Stronger confirmation: recovery to $0.09–$0.10 with volume
⚠️ Broke below $0.074? Be careful — it may seek new lows.
I wouldn’t enter with the full position here. A strategy would be to start small and increase only if the chart confirms a reversal.
LAB is about 99.7% below the ATH, so the potential is huge — but the risk is too.
Confirmed bottom or just another trap? 👀
#Labs
The price is very close to the historical low around $0.074, but we still don’t have confirmation of a bottom.
📍 Area of interest: $0.074–$0.080
🎯 Stronger confirmation: recovery to $0.09–$0.10 with volume
⚠️ Broke below $0.074? Be careful — it may seek new lows.
I wouldn’t enter with the full position here. A strategy would be to start small and increase only if the chart confirms a reversal.
LAB is about 99.7% below the ATH, so the potential is huge — but the risk is too.
Confirmed bottom or just another trap? 👀
#Labs
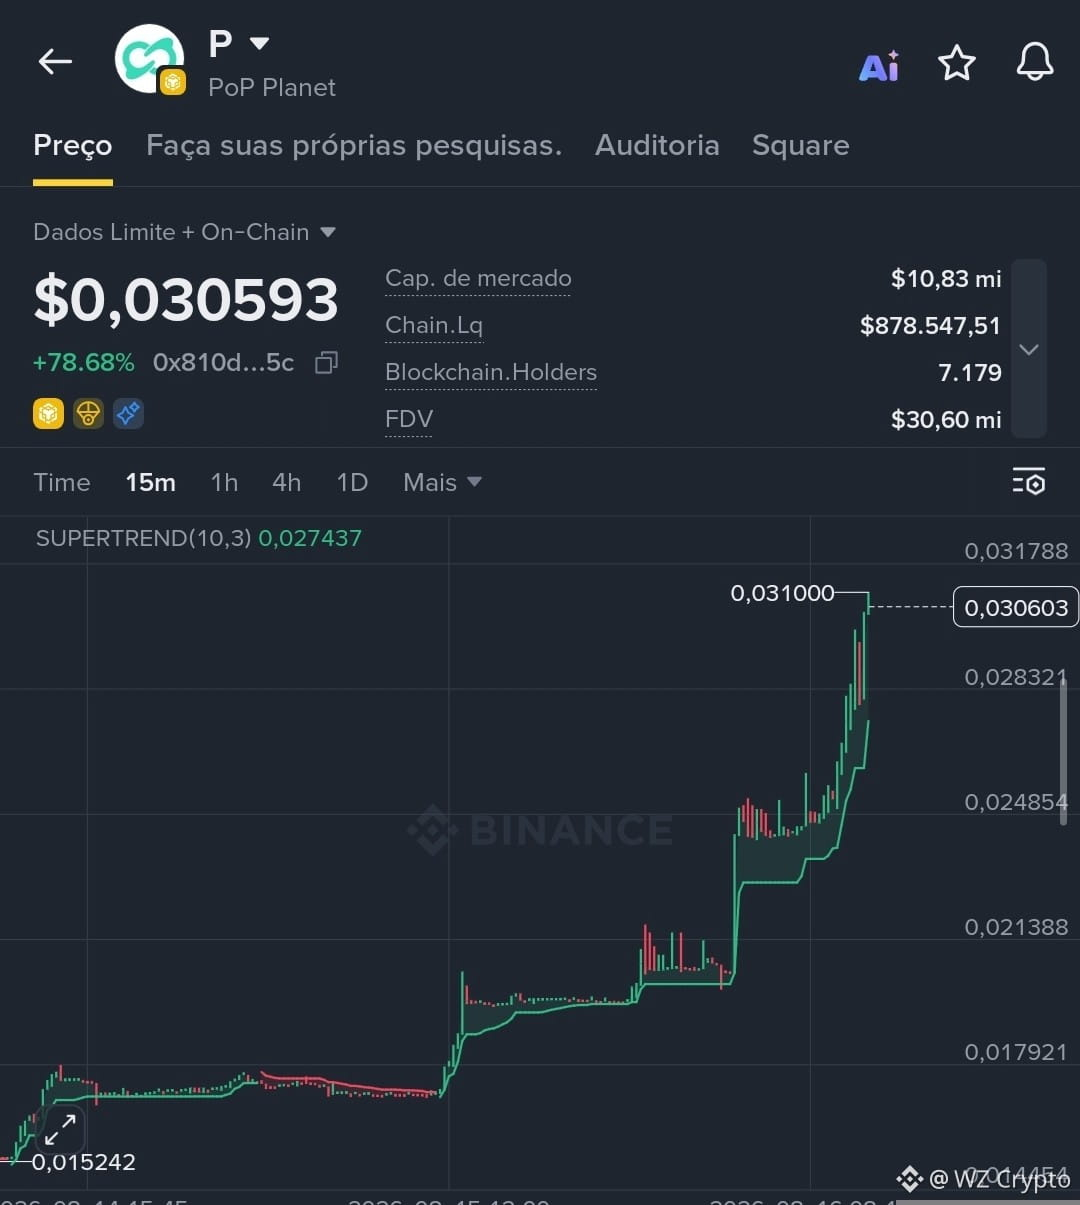
$P simply exploded! 🚀🔥
After a long accumulation, the price accelerated hard and moved from around $0.015 to hit $0.031 — a gain of more than 100% from the low shown on the chart.
Now it’s at $0.03059, with Supertrend at $0.02744 and a clearly bullish structure on the 15m timeframe.
🎯 Entries:
🟢 Conservative: $0.0275 – $0.0285 (pullback)
⚡ Aggressive: breakout of $0.0310
🎯 Targets:
🎯 TP1: $0.0330
🎯 TP2: $0.0360
🚀 TP3: $0.0400
🛑 Stop: below $0.0270
⚠️ Extremely stretched move: best entry is on the pullback or after a breakout confirmation.
Those who wait for confirmation usually end up buying more expensively — the secret is to identify the strength before the next leg.
$P
After a long accumulation, the price accelerated hard and moved from around $0.015 to hit $0.031 — a gain of more than 100% from the low shown on the chart.
Now it’s at $0.03059, with Supertrend at $0.02744 and a clearly bullish structure on the 15m timeframe.
🎯 Entries:
🟢 Conservative: $0.0275 – $0.0285 (pullback)
⚡ Aggressive: breakout of $0.0310
🎯 Targets:
🎯 TP1: $0.0330
🎯 TP2: $0.0360
🚀 TP3: $0.0400
🛑 Stop: below $0.0270
⚠️ Extremely stretched move: best entry is on the pullback or after a breakout confirmation.
Those who wait for confirmation usually end up buying more expensively — the secret is to identify the strength before the next leg.
$P

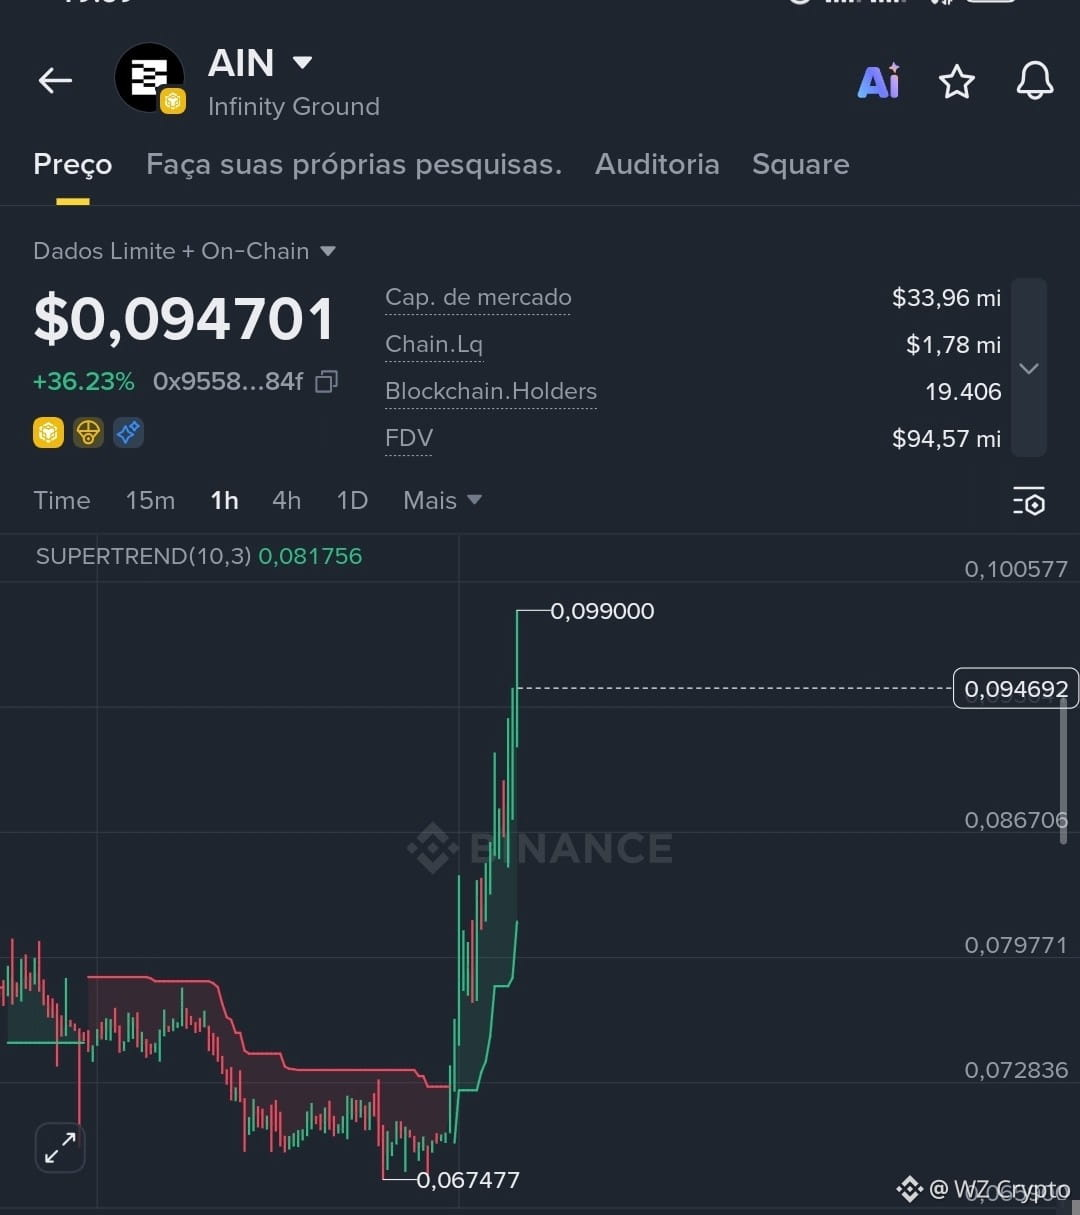
🚀 $AIN showed a strong reaction after breaking the 0.08 region and accelerated to test the high at 0.099, with buyers dominating the move in the short term.
The asset remains above the Supertrend on the 1H chart, maintaining a bullish structure and strong momentum after the resistance break.
📍Entries:
• aggressive: pullback between 0.092–0.095
• conservative: confirmed breakout above 0.099
📍Supports:
• 0.092
• 0.086
• 0.081
📍Resistance:
• 0.099
As long as it holds above 0.086, the trend stays positive. After a +36% high, volatility and profit-taking may occur before seeking new highs. 📈🔥
The asset remains above the Supertrend on the 1H chart, maintaining a bullish structure and strong momentum after the resistance break.
📍Entries:
• aggressive: pullback between 0.092–0.095
• conservative: confirmed breakout above 0.099
📍Supports:
• 0.092
• 0.086
• 0.081
📍Resistance:
• 0.099
As long as it holds above 0.086, the trend stays positive. After a +36% high, volatility and profit-taking may occur before seeking new highs. 📈🔥
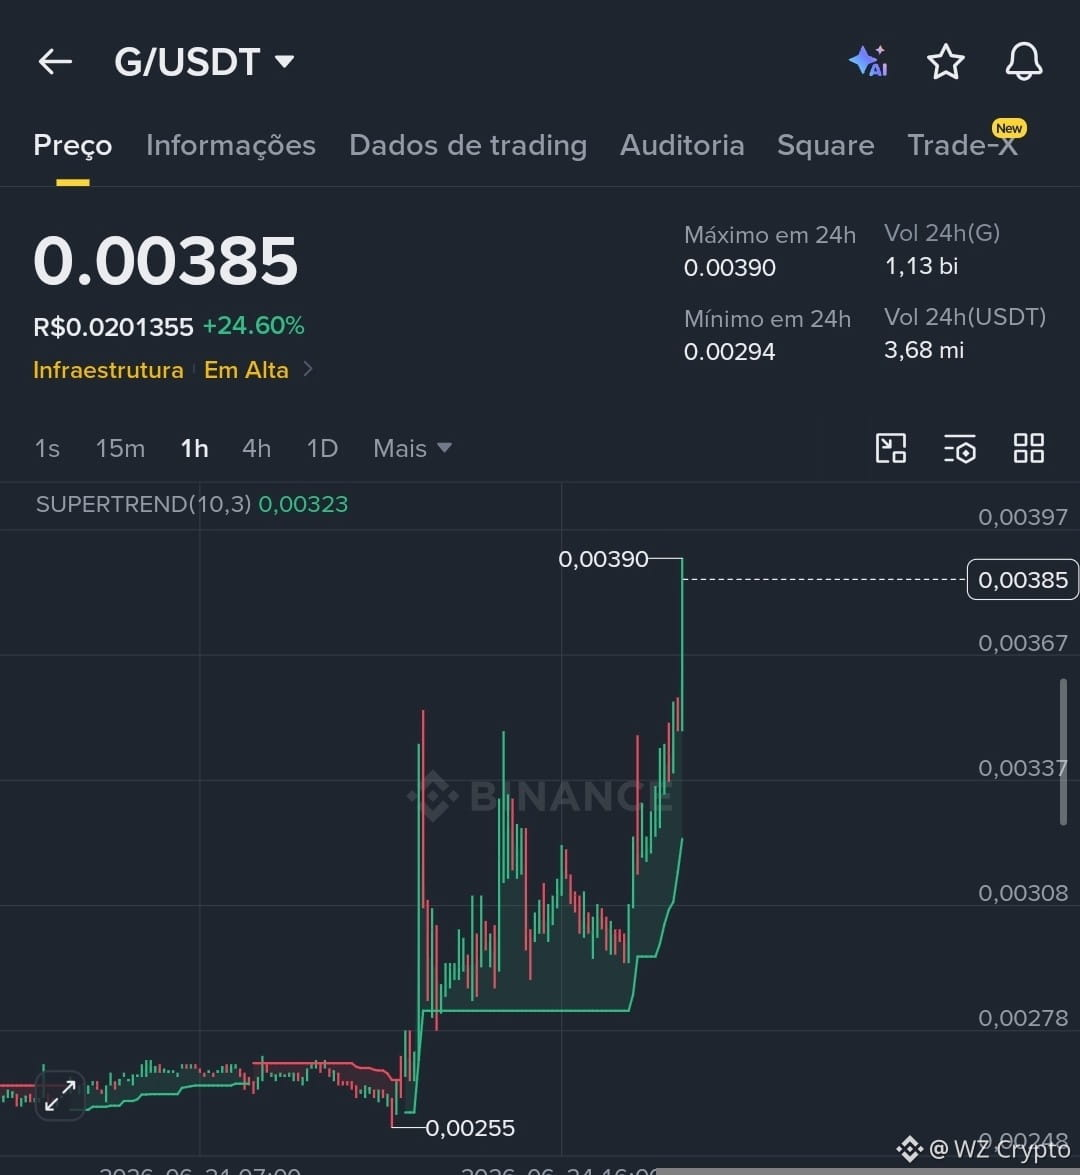
🚀 $G broke out of the accumulation zone and accelerated strongly until testing the 0.00390 region, showing buying strength and an increase in volume in the short term.
The structure remains positive as long as price stays above the Supertrend, with buyers defending the support region.
📍Entries:
• aggressive: pullback in the 0.00360–0.00370 range
• conservative: above 0.00390 with confirmation
📍Supports:
• 0.00367
• 0.00337
• 0.00308
📍Resistance:
• 0.00390
The move remains bullish, but after the strong rally, quick profit-taking may occur before another breakout attempt. 🚀📈
The structure remains positive as long as price stays above the Supertrend, with buyers defending the support region.
📍Entries:
• aggressive: pullback in the 0.00360–0.00370 range
• conservative: above 0.00390 with confirmation
📍Supports:
• 0.00367
• 0.00337
• 0.00308
📍Resistance:
• 0.00390
The move remains bullish, but after the strong rally, quick profit-taking may occur before another breakout attempt. 🚀📈
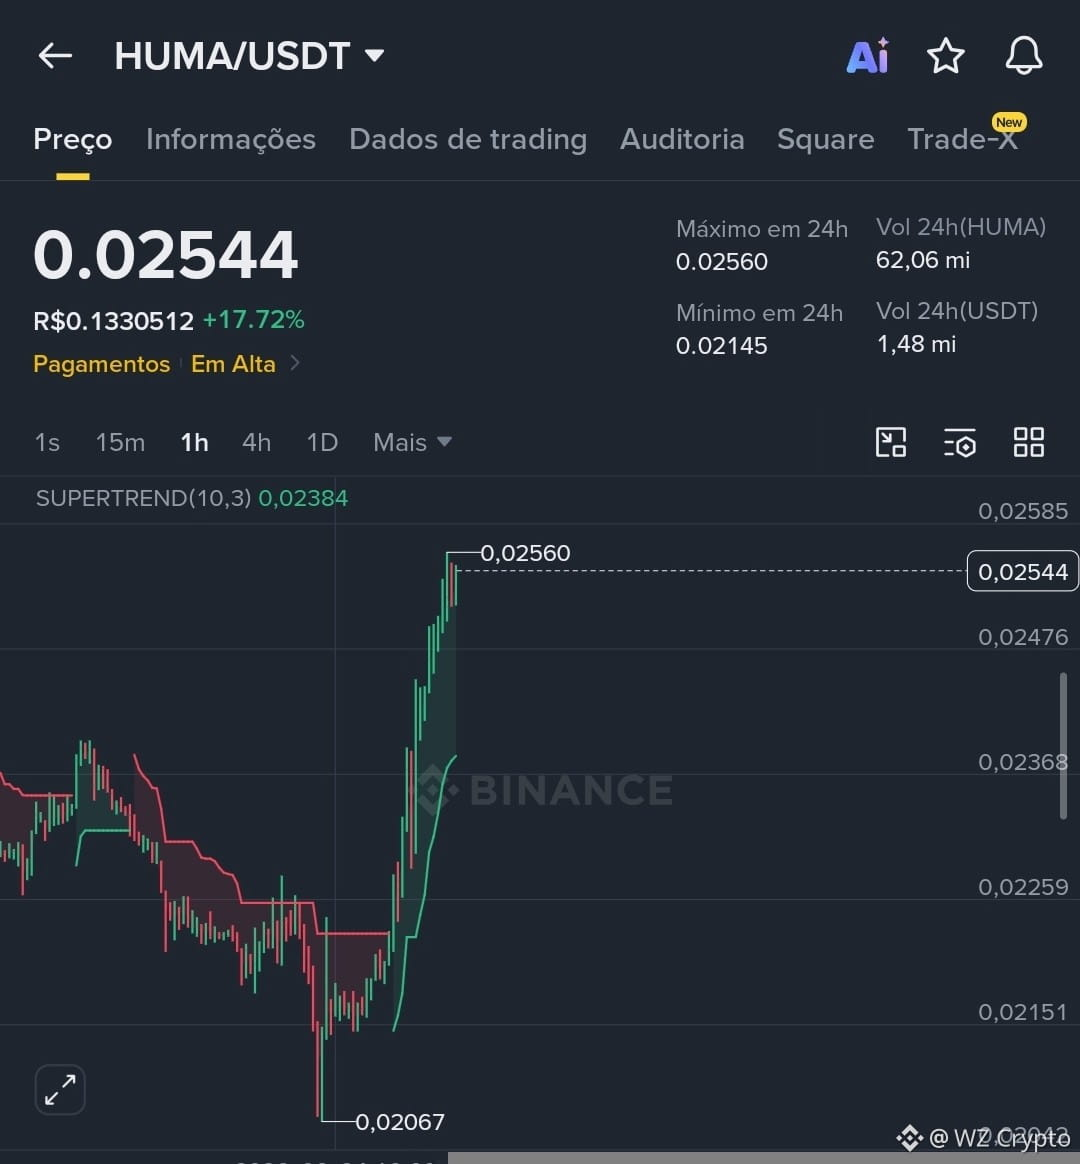
🚀 $HUMA gained strength after breaking the 0.023 region and accelerated to a high of 0.02560, showing strong buyer entry in the short term.
The asset remains above the Supertrend on the 1H timeframe, maintaining a bullish structure with volume following the upward move.
📍Entries:
• aggressive: pullback between 0.0247–0.0250
• conservative: confirmed breakout above 0.0256
📍Supports:
• 0.0247
• 0.0238
• 0.0226
As long as it holds above 0.0238, the trend stays positive. The 0.0256 region is the immediate resistance and may bring volatility before a new expansion. 📈🔥
The asset remains above the Supertrend on the 1H timeframe, maintaining a bullish structure with volume following the upward move.
📍Entries:
• aggressive: pullback between 0.0247–0.0250
• conservative: confirmed breakout above 0.0256
📍Supports:
• 0.0247
• 0.0238
• 0.0226
As long as it holds above 0.0238, the trend stays positive. The 0.0256 region is the immediate resistance and may bring volatility before a new expansion. 📈🔥
Log in to explore more content