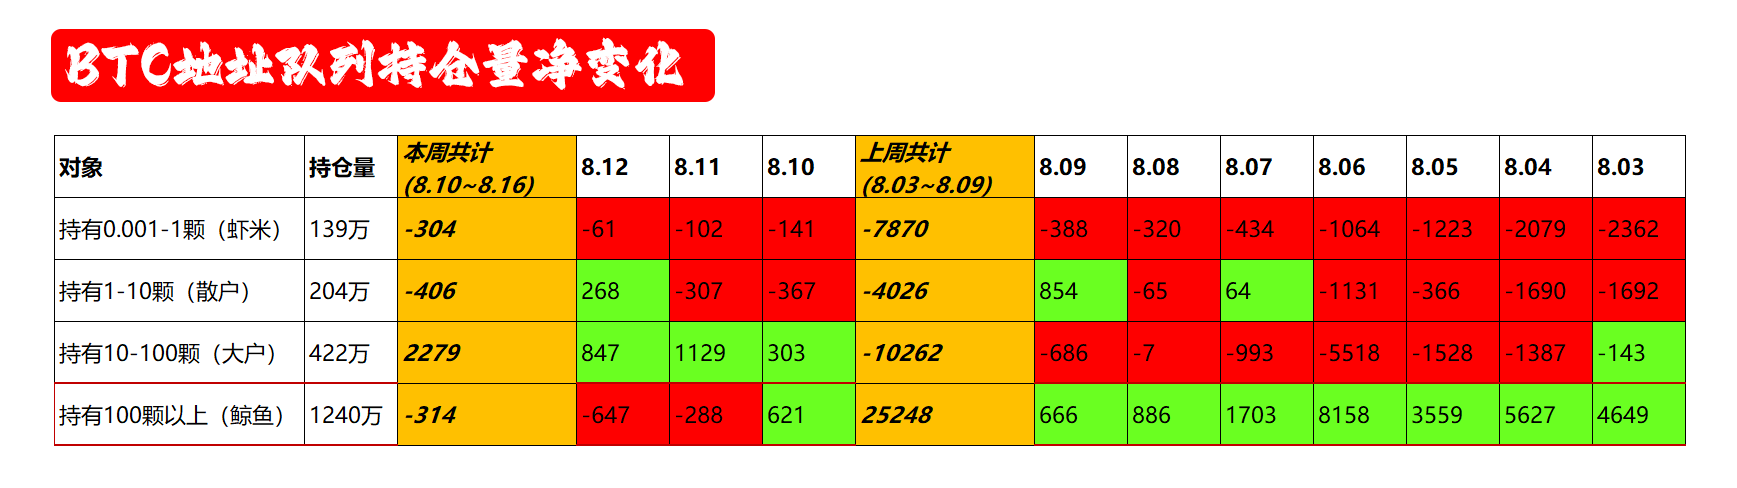
First, look at the whale addresses section in the chart. Yesterday and the day before yesterday both saw net outflows of several hundred coins, which is not a good sign. The sell pressure in the market is clearly visible. Of course, this figure may not be perfectly accurate either, because the prior cold-wallet theft incident could affect it—some portion of what’s held in whale addresses may still flow out to other cold wallets or exchanges. That’s possible as well. But the proportion should not be large. So we’re keeping a close watch to see whether this net outflow continues and whether the severity will become worse. If it does, then the market行情 may well enter a sustained period of adjustment.
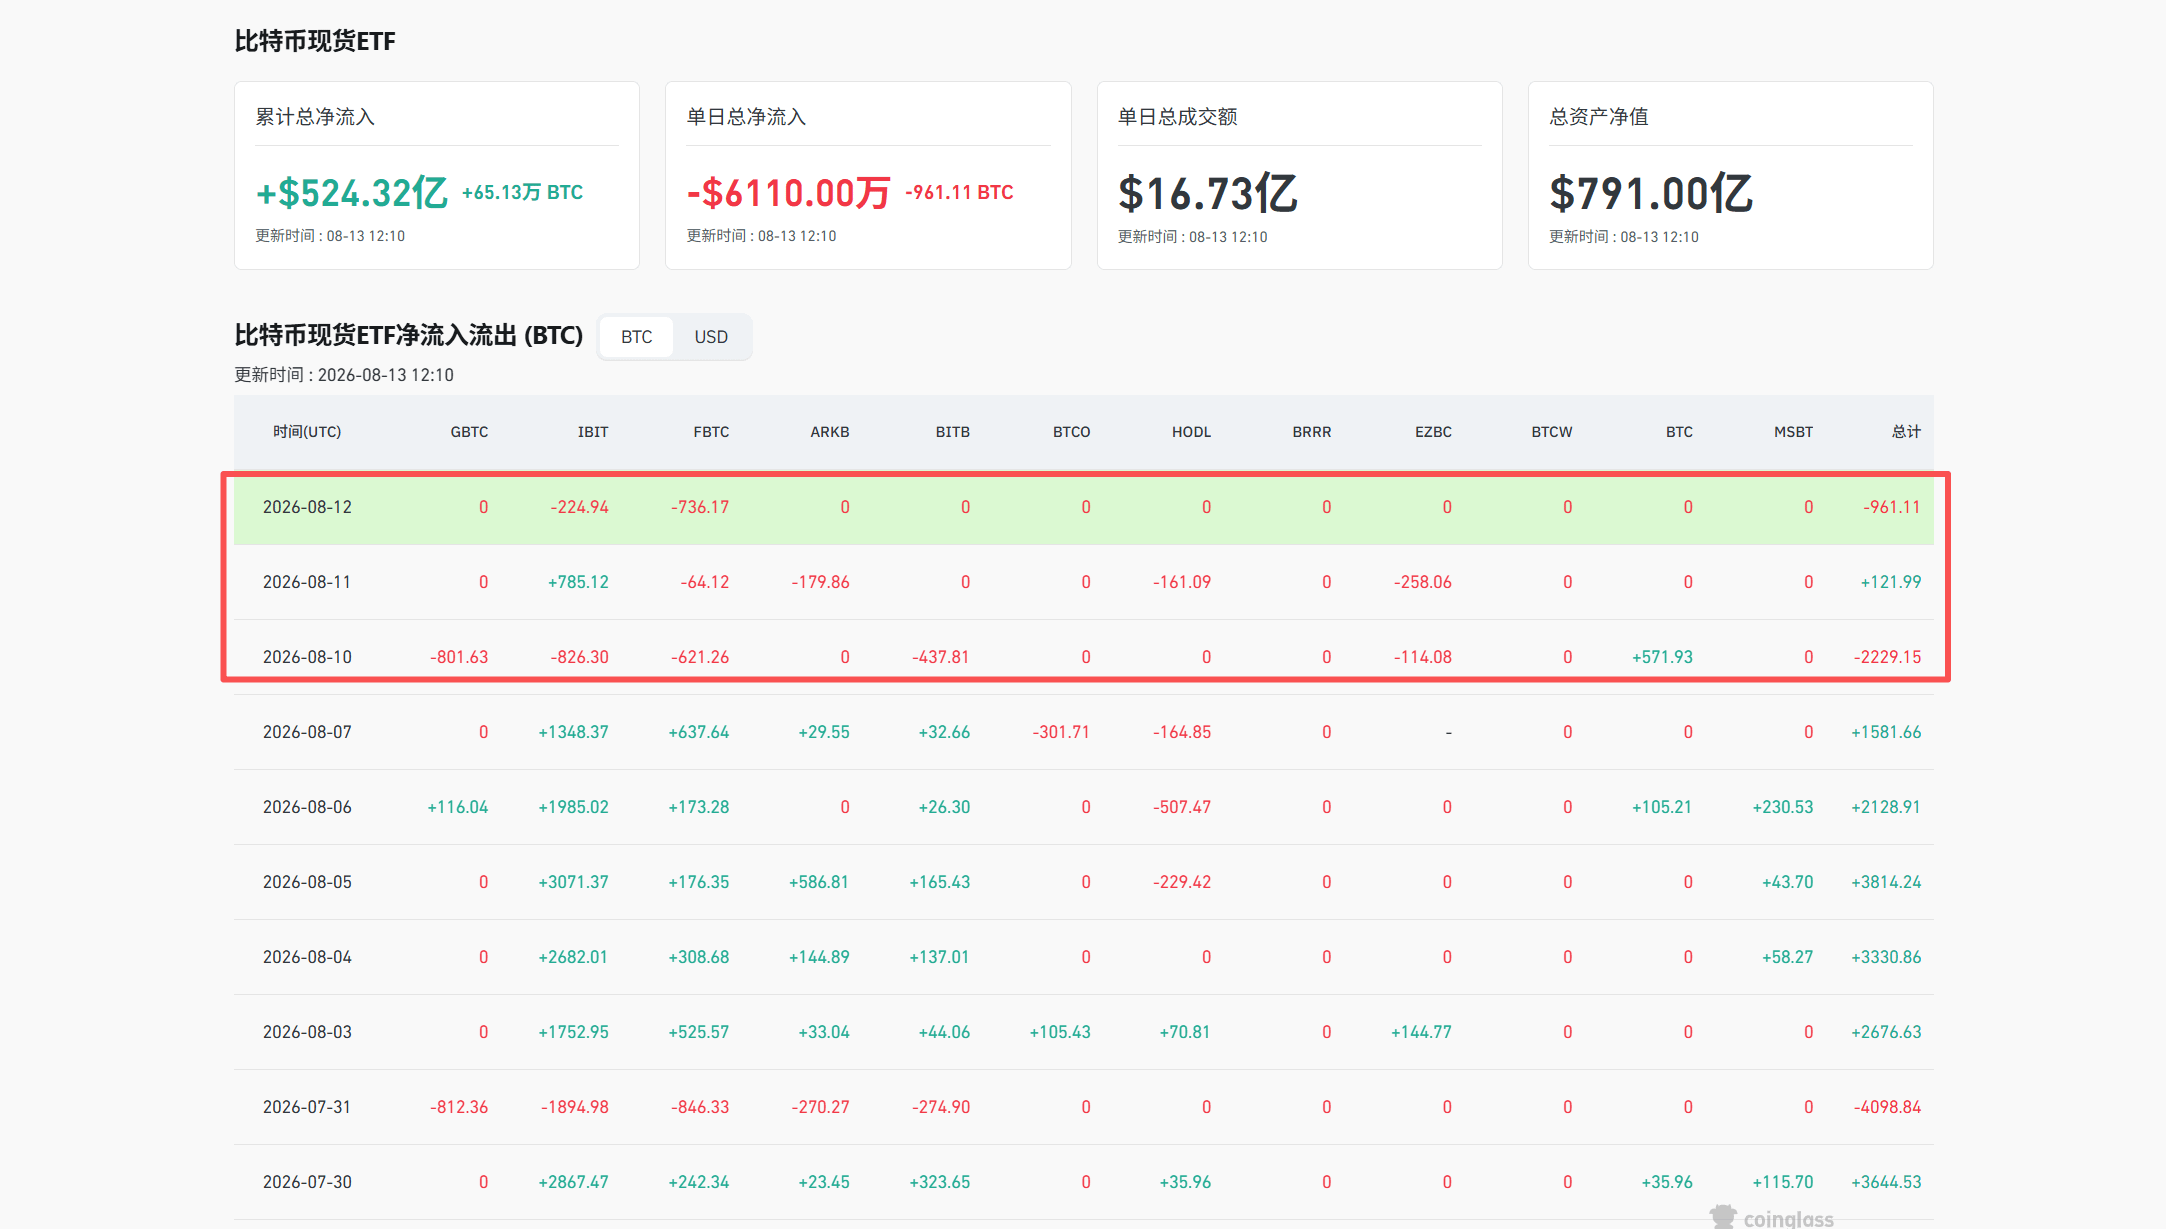
And data from the spot ETF also shows that over these two days, as the price swung sharply up and down, the numbers have been unstable. This week is still negative. If the net outflow situation continues to expand tomorrow and the day after, then a decline is inevitable.
Back to the chart, based on the current trend, my views are:
1. Personally, I lean toward a downward consolidation, and the target area is roughly around 62800. Will it go even lower? I think that if the price reaches the 62800 area, then regardless of whether it rebounds or breaks down again, there should be even lower areas—for example, around 62000. So when would this idea get “slapped”? From this moment onward, if the price continues rising, breaks through, and holds above the 64500 area, then the price could shift from weak to strong, and the order of the uptrend could resume. That’s why a bit above 64500 can be used as a key defensive level for shorts to watch.
2. For the price to reach the 64500 area, first it needs to break through the key resistance around the 64100 area. If the price runs into resistance and pulls back near this key level, and if it gets targeted by shorts, then you can consider executing a short-term short position. But don’t forget to manage your risk.
3. The price has been oscillating in the range of [62000-66000] for more than a month—only 4,000 points. As for whether it will ultimately see a blowout rally or a big drop, I think the time for this direction to be chosen is getting close. A big selloff definitely hasn’t finished yet. So, is this more-than-one-month rebound about to end? It depends on how the price reacts to key major support below—for example, around 61000. Haha.
In summary, just for reference.