
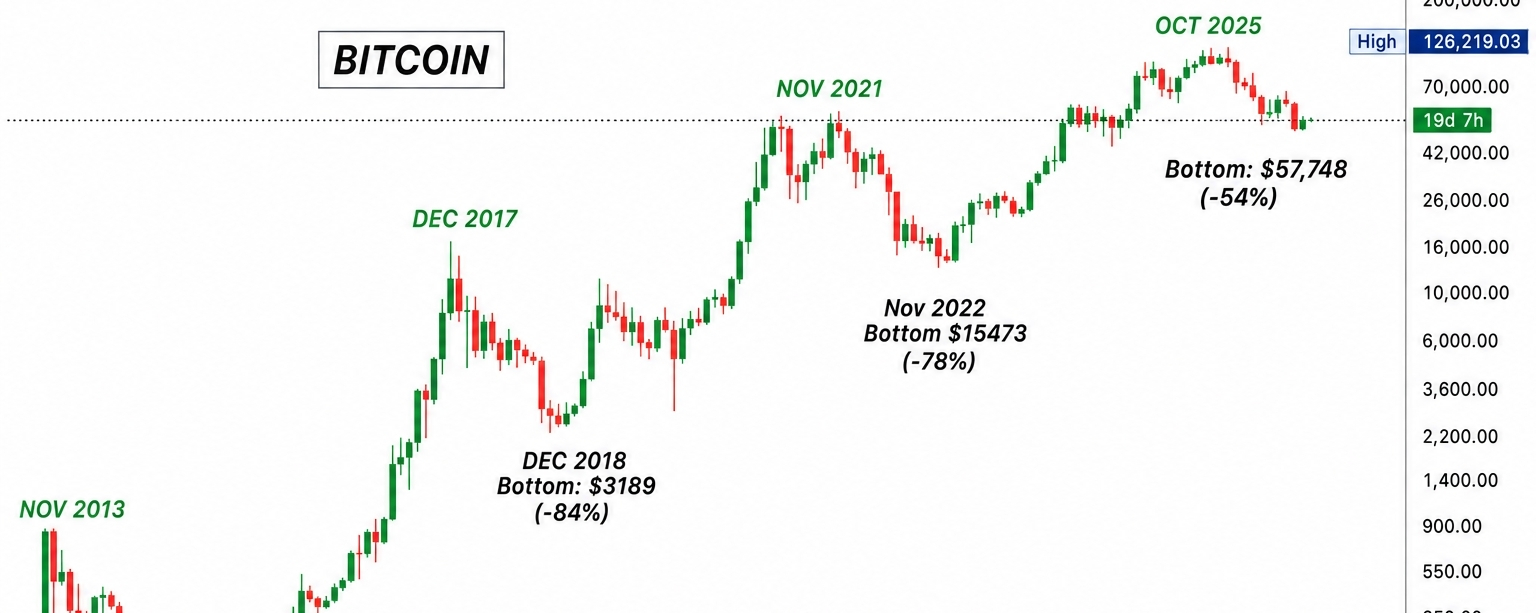

Bitcoin is once again sitting at a critical point. After recovering from the heavy weakness seen earlier in 2026, BTC has stabilized around the $63,000–$64,000 region. But the big question remains: is Bitcoin quietly building a bottom, or is this simply a pause before another major decline?
The current price action gives both bulls and bears reasons to stay cautious. Bitcoin has stopped falling aggressively, but it has also struggled to produce the kind of strong breakout that would clearly confirm a new bullish trend.
Bitcoin Is Trying to Find Support
One encouraging sign is that buyers continue to appear when Bitcoin moves toward the lower part of its recent range.
The $60,000–$61,000 area has become an important zone to watch. Bitcoin has spent much of the recent period trading between roughly $61,000 and $67,000, making the lower end of that range particularly important for market confidence.
If buyers continue defending this region, Bitcoin could slowly create a stronger base. Market bottoms often develop through periods of consolidation rather than one dramatic reversal.
That means boring price action isn't necessarily bad. Bitcoin moving sideways while selling pressure gradually decreases can sometimes be healthier than a fast rally driven mainly by speculation.
But Institutional Demand Is Still a Question
One of the biggest issues is the strength of institutional demand.
Recent reports indicate that Bitcoin ETF momentum has weakened, with fresh outflows appearing as U.S. buying pressure faded. That matters because institutional flows can provide additional demand during recovery periods.
If ETF demand improves while Bitcoin continues holding support, the argument for a developing bottom would become stronger.
On the other hand, continued outflows combined with falling prices would make the current recovery look much more fragile.
The $60K Area Could Decide the Next Chapter
From a technical perspective, Bitcoin does not have unlimited room to move lower while keeping the current structure intact.
The region around $60,000–$61,000 is one of the most important areas to monitor. A sustained breakdown below it could expose Bitcoin to another wave of selling pressure. Some recent technical analysis has highlighted the mid-$50,000 region as a possible area of interest if this support fails.
However, traders should be careful about treating any single price target as guaranteed. Bitcoin is highly volatile, and technical patterns frequently fail.
The important part is the reaction around support.
A quick dip followed by aggressive buying would look very different from Bitcoin breaking support and remaining below it for several days.
Bulls Also Need to Prove Something
Holding support alone isn't enough to confirm that the bottom is finished.
Bitcoin also needs to reclaim resistance.
The $66,000–$67,000 region has recently acted as an important upper boundary. A convincing move above this area, especially with stronger trading volume and improving demand, would provide much better evidence that buyers are regaining control.
Until that happens, Bitcoin could simply remain trapped inside a broad consolidation range.
That creates a relatively straightforward battle: bulls want to defend the lower range and reclaim resistance, while bears want to push BTC decisively below support.
Macroeconomic Conditions Still Matter
Bitcoin isn't trading in isolation.
Investors are currently paying close attention to U.S. inflation data, Federal Reserve expectations, and geopolitical uncertainty. Bitcoin recently traded around $63,600 as markets remained cautious ahead of inflation data and amid geopolitical concerns.
Changes in interest-rate expectations can quickly influence risk assets.
If financial conditions become more supportive and investors become comfortable taking additional risk, Bitcoin could benefit.
But renewed inflation concerns or another major risk-off event could create fresh selling pressure across crypto.
August Adds Another Layer of Uncertainty
Seasonality is also attracting attention.
Bitcoin has recorded negative August returns for several consecutive years, although historical patterns should never be treated as predictions. Every market cycle develops under different liquidity, macroeconomic, and investor conditions.
Still, the historical weakness gives traders another reason to watch the current support structure carefully rather than assuming the correction has already ended.
Bitcoin doesn't need to repeat history.
But it does need buyers to prove that this year will be different.
What Would a Real Bottom Look Like?
A stronger bottoming structure would likely involve several developments happening together.
Bitcoin would continue defending major support, selling pressure would weaken, institutional demand would improve, and BTC would eventually break above its recent resistance with convincing volume.
One signal alone wouldn't prove much.
Together, however, they could indicate that the market has moved from correction into accumulation.
The opposite would also matter. Weak demand combined with a decisive loss of support could suggest that Bitcoin still needs to search for a lower equilibrium.
So, Is the Bottom In?
Right now, the evidence remains mixed.
Bitcoin has shown enough stability to make a bottoming scenario possible, but it hasn't produced enough strength to confirm it.
The area around $60,000–$61,000 remains important on the downside, while roughly $66,000–$67,000 is an important region for bulls to reclaim. Those boundaries can help show whether the current consolidation develops into accumulation or another leg lower.
Instead of trying to predict the exact bottom, it may be more useful to watch how Bitcoin behaves around these key areas.
The next major move could tell us whether the market has finally found its floor—or whether Bitcoin still has one more test ahead.
This article is for educational and informational purposes only and is not financial advice.