
We often hear names like whales, giant whales, and ancient giant whales. If we compare the entire Bitcoin holding ecosystem to the ocean ecosystem, what would the distribution be like? This week, such an analysis was published on Glassnide Insight. Let me translate it for you and let you understand this kind of macro chain data in the most simple and easy-to-understand way.
Cryptocurrency Ocean Ecosystem
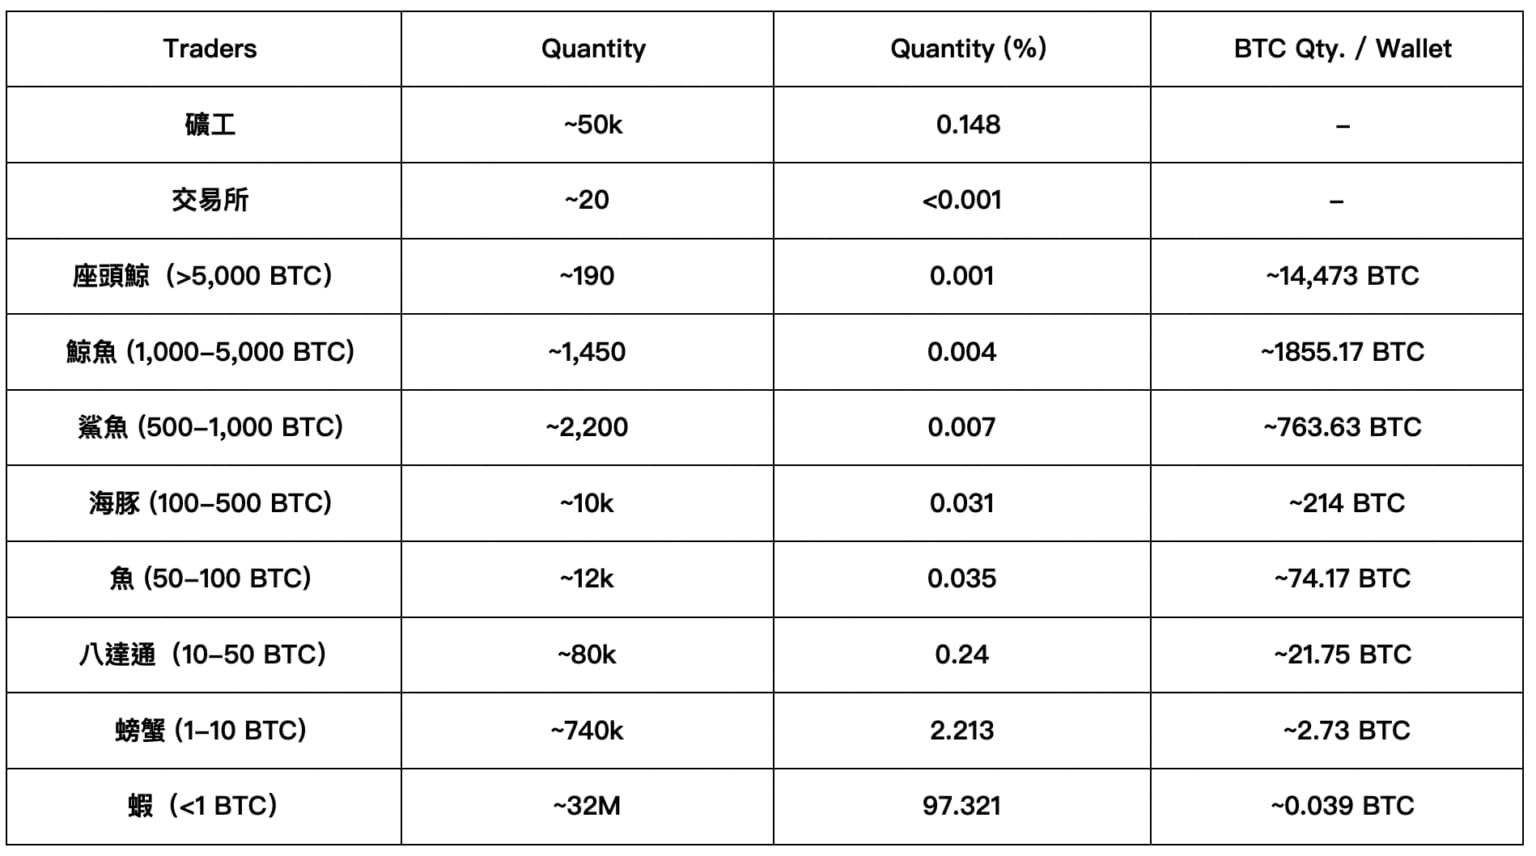
First, we will simply divide the number of Bitcoins held, that is, the wallet balance, and give each one a name of marine life.
Shrimps (<1 BTC)
Crab (1-10 BTC)
Octopus (10-50 BTC)
Fish (50-100 BTC)
Dolphin (100-500 BTC)
Shark (500-1,000 BTC)
Whale (1,000-5,000 BTC)
Humpback (>5,000 BTC)
Exchanges and Miners.
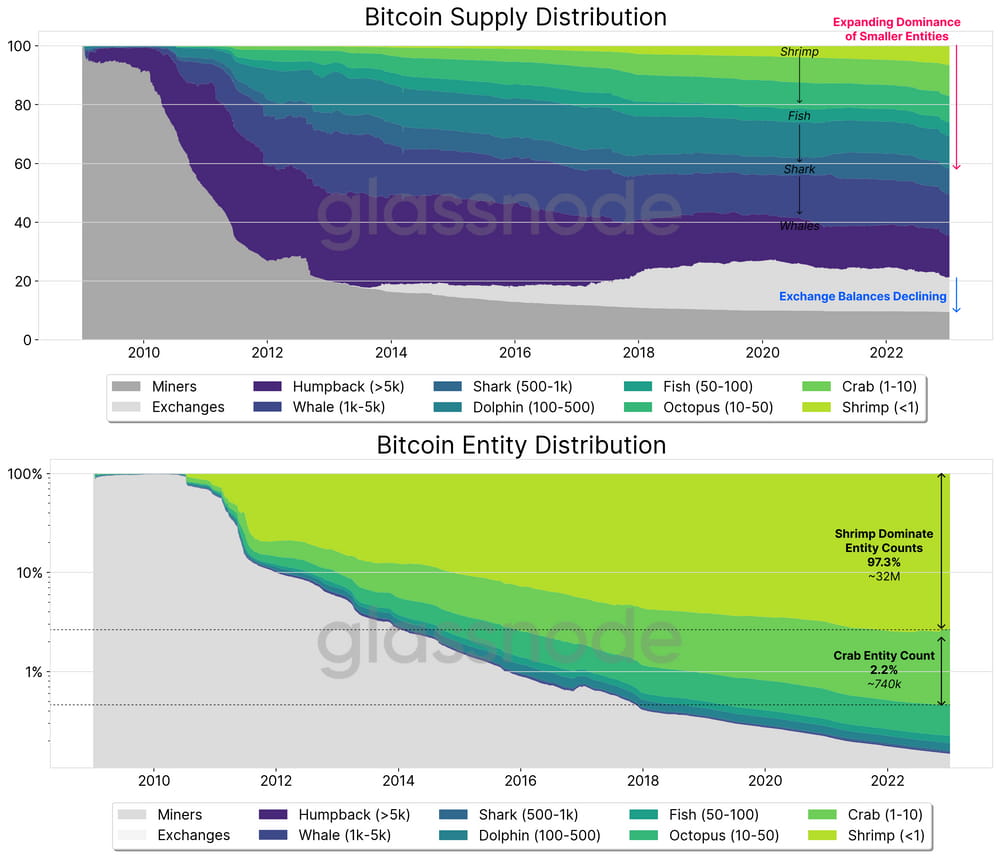
We can observe from Figure 1 that from 2008 to 2023, the changes in the amount of Bitcoin held (Supply Distubution) among holders of different levels show that basically, holders below the Fish (50-100 BTC) level have visible growth.
The exchange level has seen a significant increase in its proportion after 2013, while the miner level has slowly declined.
In terms of Entity Distubution, the number of Bitcoin holders below the Fish level (50-100 BTC) has increased significantly since 2008, while the number of miners has steadily decreased.
——
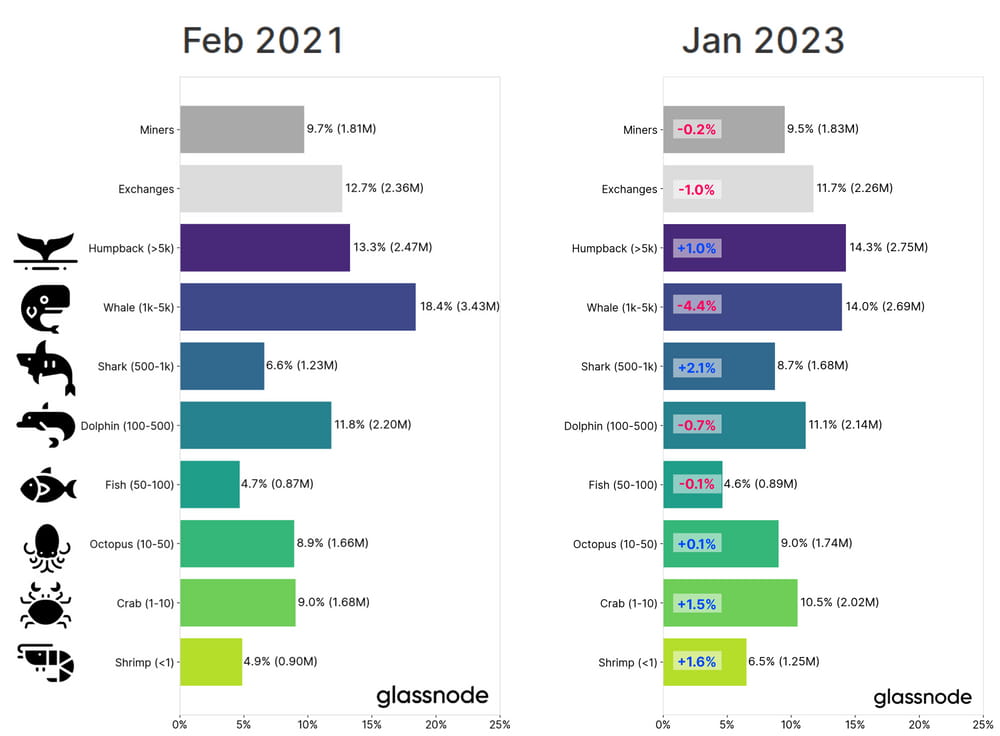
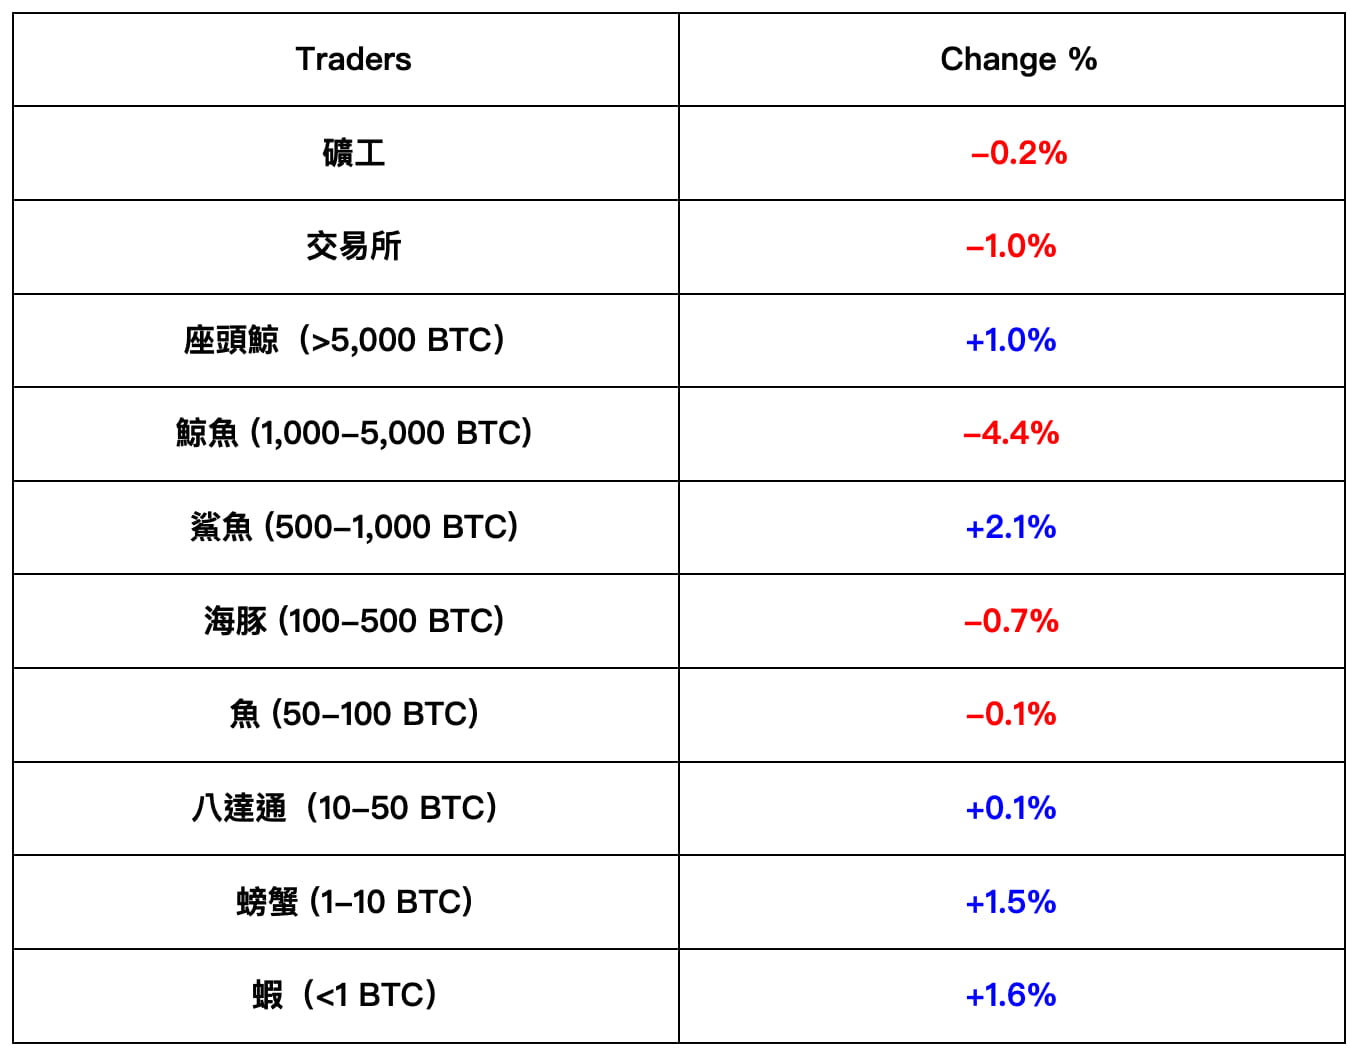
Next, we will compare the changes in the number of holdings, taking 2021 and 2023 as examples, to observe the changes in the proportion of funds in these two years.
Among them, exchanges and whales (1,000-5,000 BTC) saw the largest decrease (>1%), while sharks (500-1,000 BTC), crabs (1-10 BTC), and shrimps (<1 BTC) saw the largest increase (>1.5%). This indirectly illustrates one thing: the flow of assets and the dominance of market funds are gradually shifting from whales and large financial institutions to small investors. This is the process that will occur in a gradually maturing financial market.
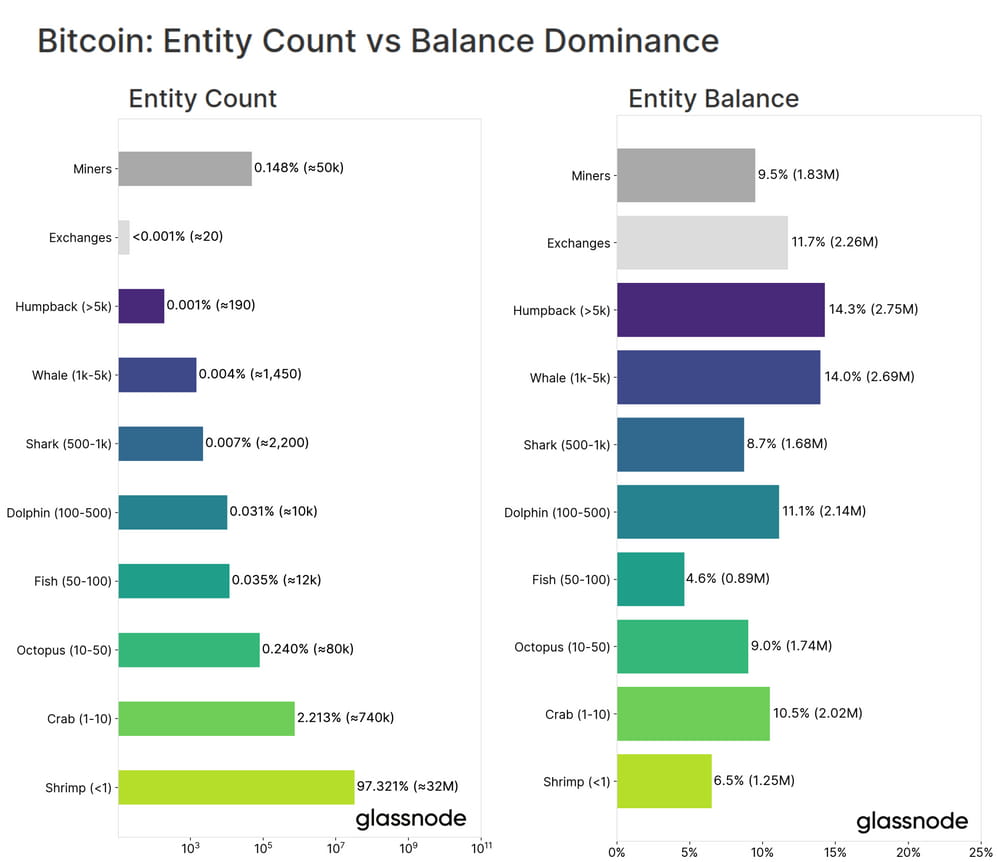
Finally, let’s analyze the number of chip holders at each level. In Table. 2, we can see that the number of shrimps holding the smallest average number of chips (<1 BTC) accounts for 97.321%. These 32M shrimps hold a total of 1.25M bitcoins, accounting for about 6.5% of the total circulation. We can further calculate the approximate average holding amount of each individual, and the results are also listed in Table. 2.
Conclusion
Back to the topic, from these data, we have observed the growth of smaller chip holders, with considerable changes in both quantity and overall value. These growth footprints reached their peak in 2022, especially after two major events (2020 Black Swan, 2022 FTX). This phenomenon has become more and more obvious, and the capital that dominates the market has also changed accordingly.
Overall, Bitcoin supply will continue to be dispersed, driven not just by miners but also by market cycles.
We are DA Traders Alliance
DA Traders Alliance (DATA) is a brand of DA Capital. It was founded by professional traders, graduates of top US business schools, and top 100 global profit earners. It provides a systematic and simple learning environment for friends who are interested in investment/trading, blockchain/cryptocurrency.