Prices may be somewhat aggressive, but the “time scale” is extremely valuable
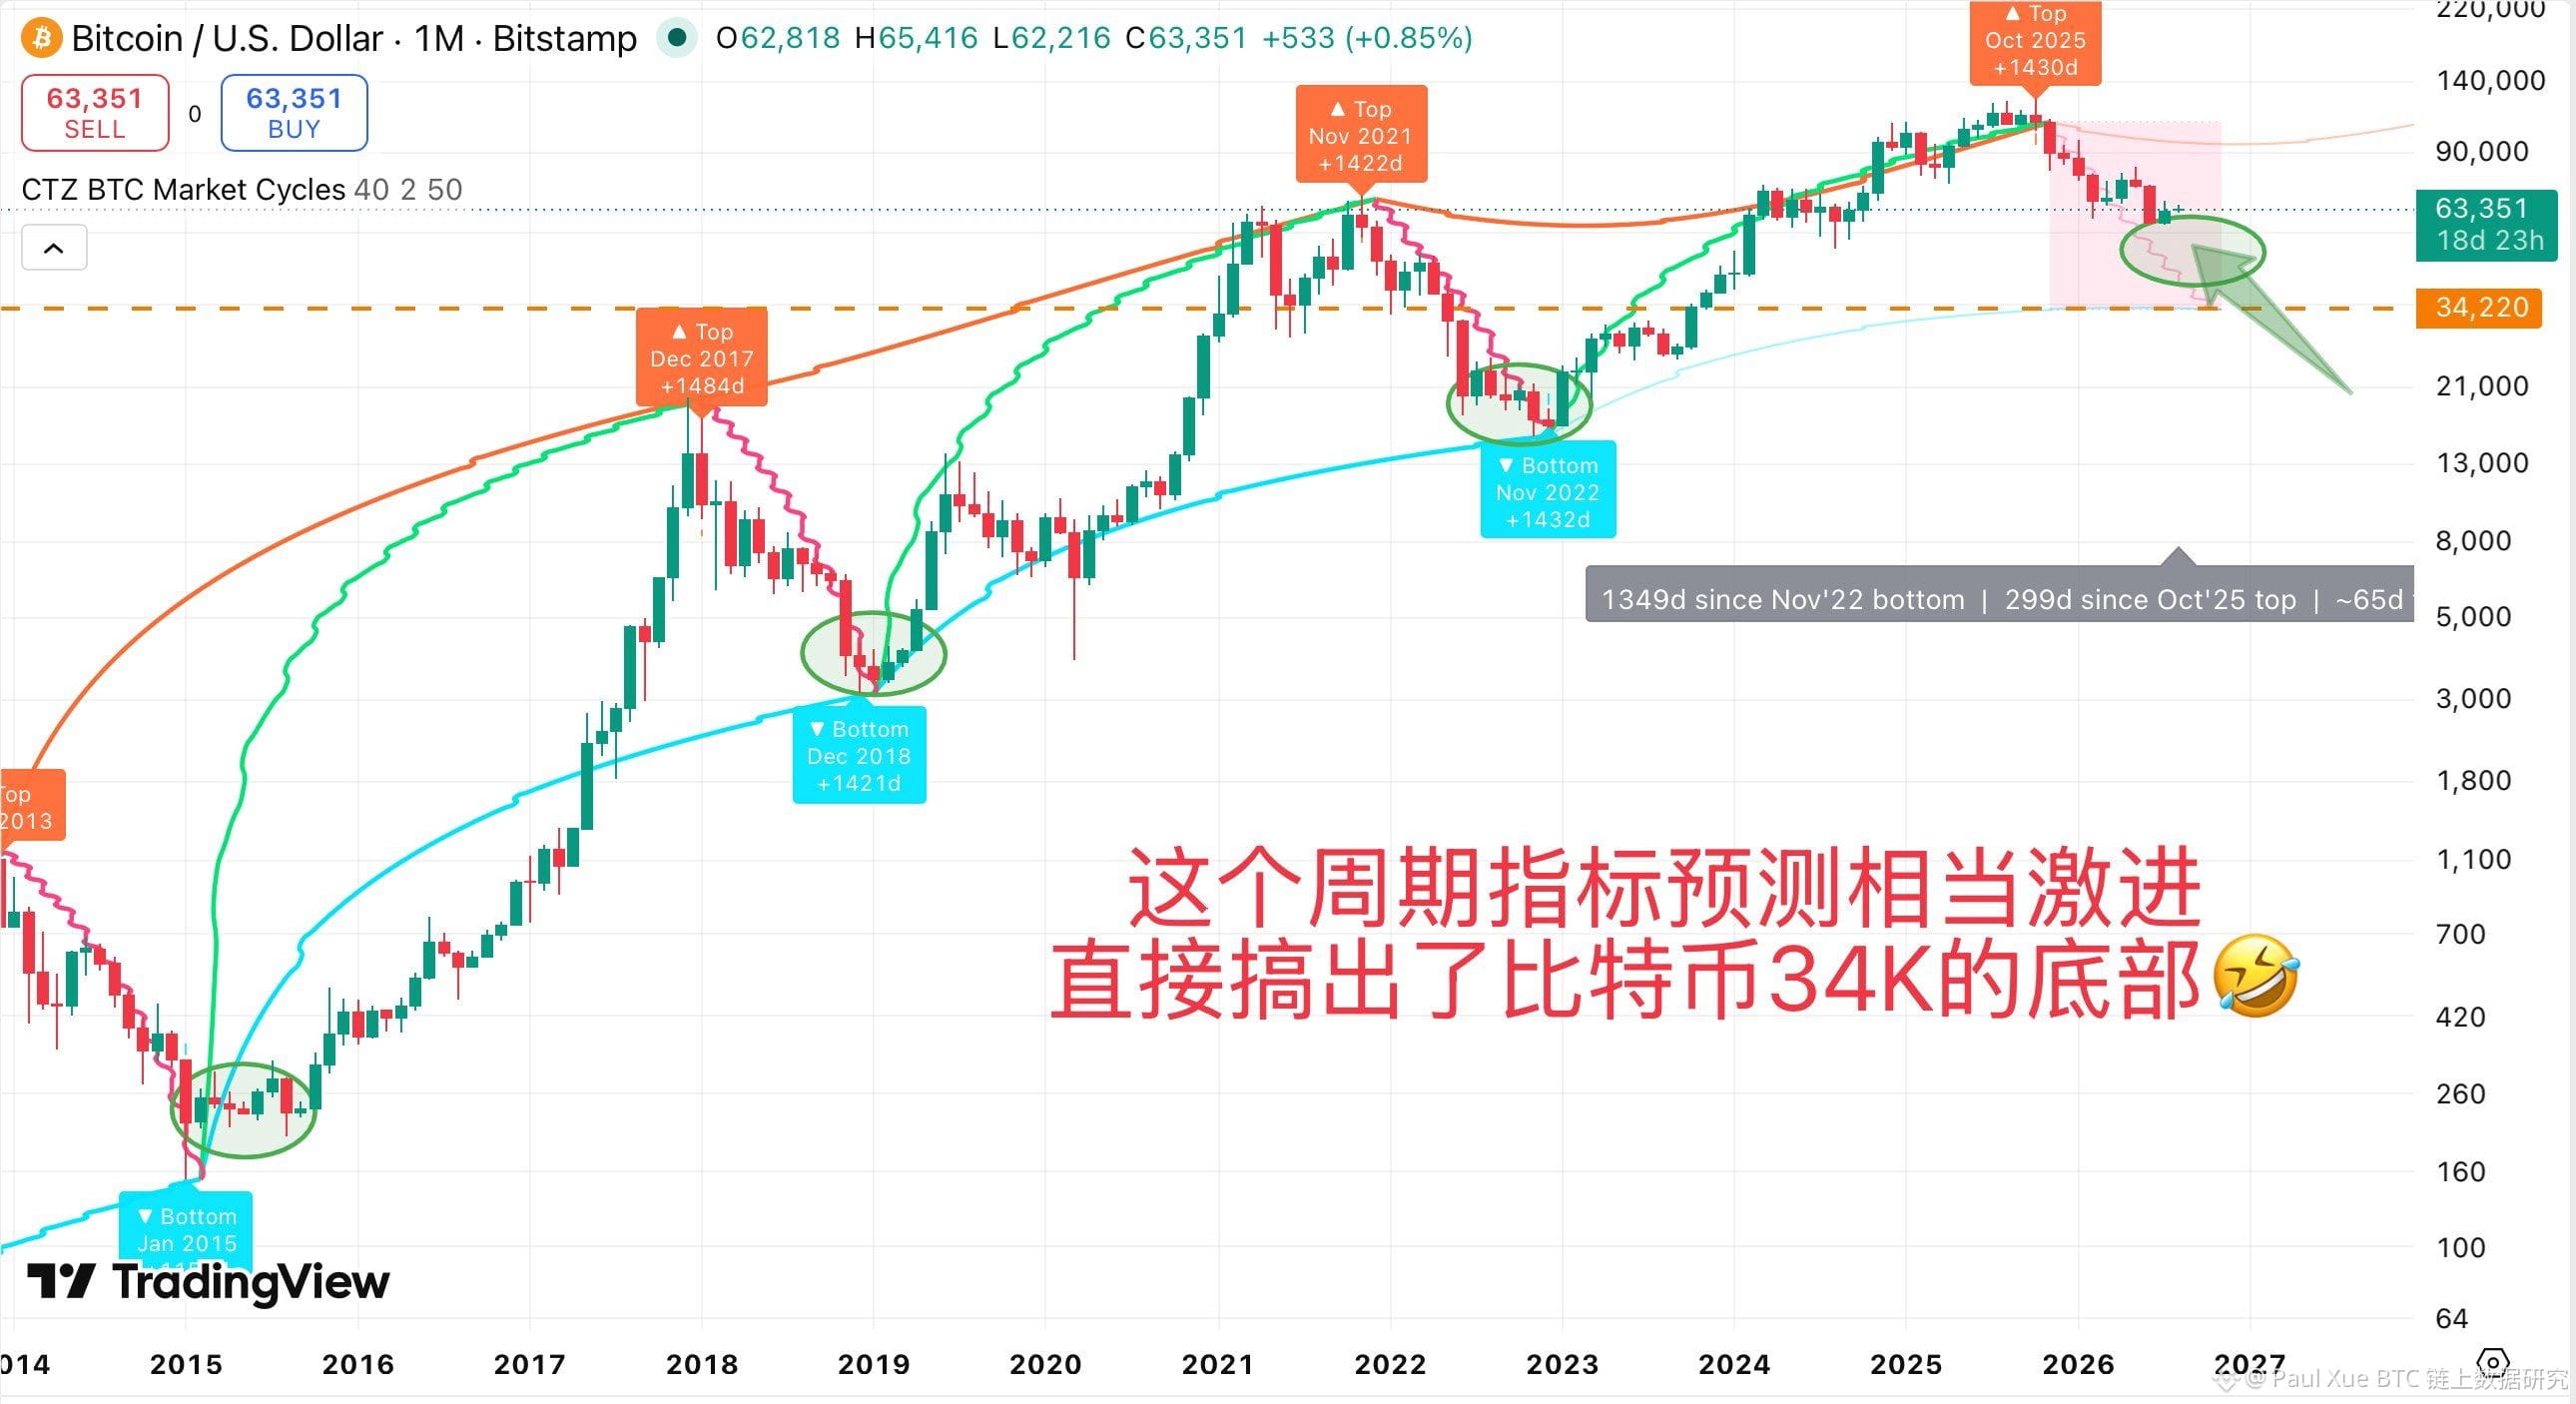
Let’s introduce a rather interesting metric: CTZ BTC Market Cycles.
This indicator offers a fairly aggressive projection—pinning the bottom of this cycle directly around the 34K area.
Given the current market size and institutional cost basis, this absolute price does indeed seem overly pessimistic.
However, setting aside price noise, the indicator’s logic for calibrating “time cycles” is very rigorous and worth learning. As can be seen from the markers in the chart,
whether at the tops of past bull markets (2017, 2021, 2025) or at the bottoms of bear markets (2018, 2022), their time intervals remain consistently around roughly 1,400+ days
—which perfectly matches Bitcoin’s four-year halving cycle.
Time-point projection:
According to the indicator, the next potential cycle bottom window falls around October 2026.
Quantitative models can become distorted in their “absolute price” assumptions due to changes in market structure, but Bitcoin’s “time cycles” driven by its code and halving mechanism have a very strong historical inertia.
Focus on time, not price—we don’t have to obsess over the 34K level, but we can place more emphasis on the time inflection point in the second half of 2026, using it as an excellent time reference for long-term capital planning and accumulation pacing.
Let’s introduce a rather interesting metric: CTZ BTC Market Cycles.
This indicator offers a fairly aggressive projection—pinning the bottom of this cycle directly around the 34K area.
Given the current market size and institutional cost basis, this absolute price does indeed seem overly pessimistic.
However, setting aside price noise, the indicator’s logic for calibrating “time cycles” is very rigorous and worth learning. As can be seen from the markers in the chart,
whether at the tops of past bull markets (2017, 2021, 2025) or at the bottoms of bear markets (2018, 2022), their time intervals remain consistently around roughly 1,400+ days
—which perfectly matches Bitcoin’s four-year halving cycle.
Time-point projection:
According to the indicator, the next potential cycle bottom window falls around October 2026.
Quantitative models can become distorted in their “absolute price” assumptions due to changes in market structure, but Bitcoin’s “time cycles” driven by its code and halving mechanism have a very strong historical inertia.
Focus on time, not price—we don’t have to obsess over the 34K level, but we can place more emphasis on the time inflection point in the second half of 2026, using it as an excellent time reference for long-term capital planning and accumulation pacing.