12/08/2026
Fundamental Analysis
Quarterly Results (Q3 FY26 - Jul/30/2026): Apple posted record results for the June quarter with $109.4 billion in revenue (+16% year-over-year) and EPS of $2.02, beating estimates. iPhone revenue reached $54.3B and Services $30.7B. However, the market executed a classic “Sell the News” after hitting its ATH of $345.
Rating Downgrade and Analyst Caution (Aug/10/2026): Analysts from firms such as Jefferies cut short-term outlooks, citing concerns about the rising cost of memory components, the slowing pace or gradual adoption of AI features (Siri AI), and a valuation that was positioned around 8-9% above its fair value (GF Value at $282).
Operating Environment: Open Interest in the AAPLUSDT pair has been rising steadily (92K contracts) while the price falls, confirming massive entry of institutional short positions (Short positioning).
Technical Analysis:
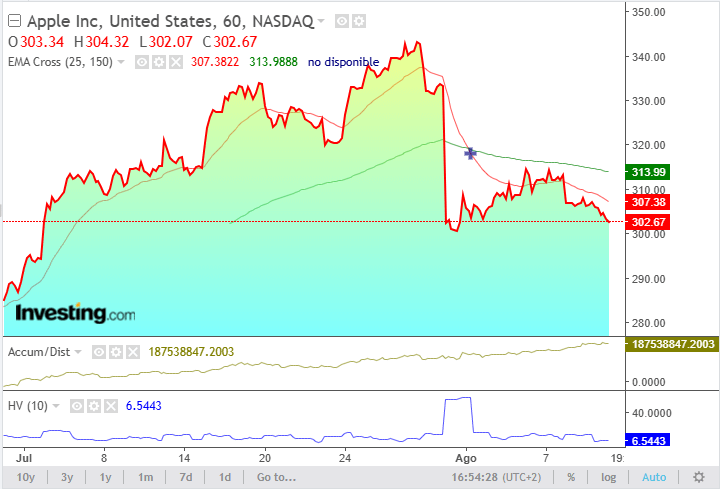
Despite posting record quarterly revenue of $109.4B, the market applied the classic “buy the rumor and sell the news” maxim. On intraday timeframes (15m and 1h), the structure has shifted bearish (Break of Structure), supported by a bearish EMA cross and a clear sweep of liquidity (fakeout) at $306.
Price rests on the critical level of $302.60 and the daily 100 EMA. Losing the psychological support at $300 would accelerate selling toward zones of high inefficiency.
Mapping Fair Value Gaps (FVG) and Order Flow
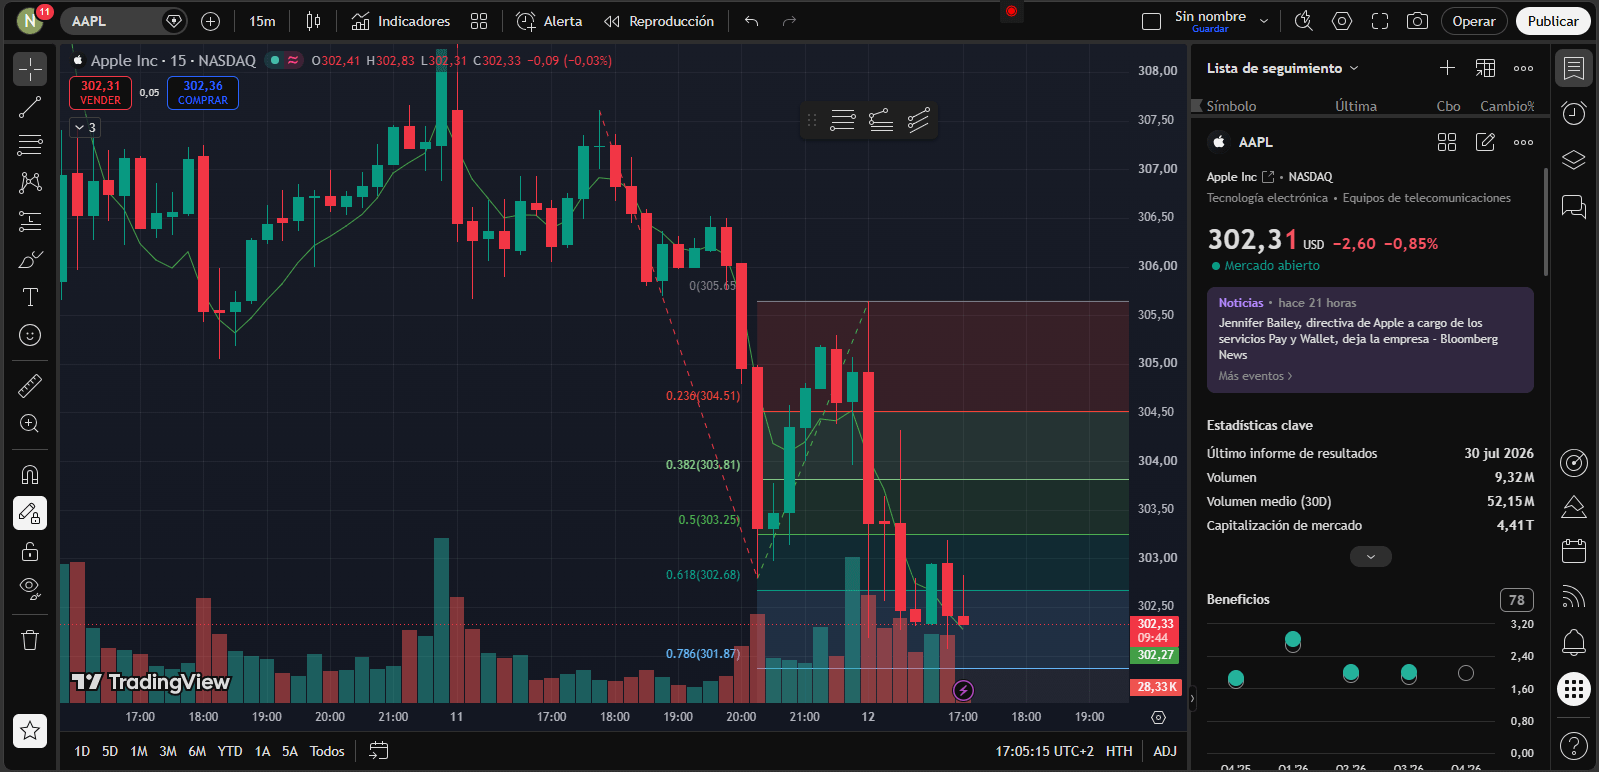
Intrad day FVG (15m): Active supply zone located between $304.50 and $305.65. Every attempt to rebalance within this block is being rejected by sell-side volume.
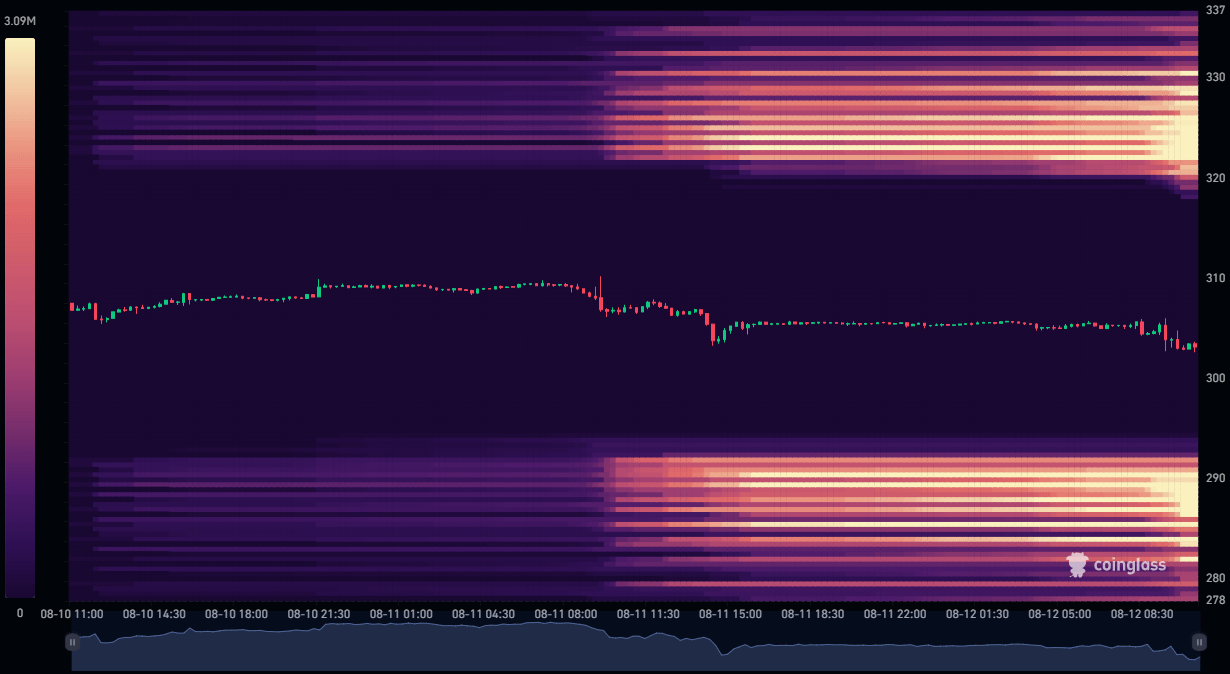
Lower Liquidity Pool: The order book heatmap shows a massive accumulation of buy-side liquidity concentrated between $280 and $290, making that range act as a magnet for price if the current structure breaks.
2 Operational Roadmaps
1. Day Trading (Perpetual Futures - Short-Term Focus)
Entry: $304.50 - $305.20 (Intrad ay FVG fill)
Stop Loss: $307.30
TP1: $301.90 | TP2: $298.50 | TP3: $294.20
2. Swing Trading / Spot (Staggered Accumulation)
Buying Zone: Entry at $298.00 (30% of capital) and a strong re-entry at $282.00 - $285.00 (70% within the Heatmap block and SMA 200)
Stop Loss: $269.50
TP1: $314.00 | TP2: $330.00 | TP3: $344.50 (Return to ATH)
⚠️ Important: The information shared is not a buy or sell recommendation. Do your own research (DYOR) before making any decision.
What’s your move in this scenario? Do you think the $300 barrier will hold against selling pressure, or will we sweep deep liquidity at $280 before tackling the last-quarter rally? Share your opinion in the comments, leave a like 👍 if this technical breakdown was useful to you, and follow me so you don’t miss the next real-time alerts.
🔥I invite you to our public group:
The Fantastic Traders🔥🚀💵
May the power of the trend be with you! 🔥💚🔥
#Binance #AAPL #NASDAQ #losfantasticosdeltrading #nuricrypto