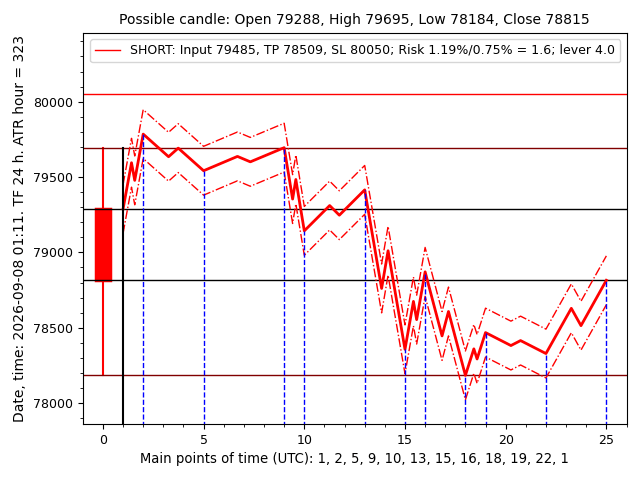
In the header of the photo, the calculated parameters of a possible conditional candle (Possible candle) are shown—from the current price at the time the calculation is performed to the price by the end of the timeframe (Open, High, Low, Close). The candle is forecast using a complex algorithm with AI technology. The news backdrop was not taken into account. In the absence of significant news, the parameters of the calculated candle are obtained with sufficient accuracy. Good news may shift the candle’s High, Low, and Close slightly upward; bad news—downward. On the left side of the photo, this calculated candle is shown. Also on the left, the date and time of the calculation, the timeframe TF, and the average hourly ATR are provided. Prices are given in USDT, and time is in hours (UTC). The initial data used for the calculations was taken from the Binance exchange futures chart.
Chart.
The assumed price movement scenario is shown by a chart with three lines in the color of the candlesticks: it has a solid main line, and on both sides two dotted lines that imitate halves of the possible deviations by ATR.
The chart follows the classic pattern: two three-wave ABC structures at the beginning and at the end of the chart, and a five-wave structure according to the Elliott waves in the middle part.
You need to understand that this chart is only a possible and probable price movement model. The actual behavior of the price may differ in details.
On the horizontal axis are plotted statistically most probable turning points in time.
Orders.
One or two orders (Long and/or Short) are provided as an example. They are generated by a program taking into account the requirement for their more or less probable execution within the calculated candle.
The trade entry points (input) are selected by the program to be as logical and optimal as possible for the specific conditions. The entries themselves are preferably made after confirmed reversals. Your entry points may differ. In some cases, well-thought-out entry points from the current prices or a “stair-step” set of positions are possible.
The take-profit points (TP – teik-profit) are selected as statistically sufficiently likely, but for each position there may be several as well. Statistically, take-profit almost always triggers on its own if the profit set by it is between 0.8 and 1.0 percent of the trading deposit in this trade.
The “emergency” trade close levels (SL – stop-loss) are calculated considering the specific market situation in such a way that they are as close as possible, but statistically trigger as rarely as possible. In the photo, the stop-loss is shown as horizontal lines: for Short positions in red on top, and for Long positions in green at the bottom of the chart.
Risk coefficients, Risk, are calculated using the formula: Risk ratio = profit / loss, where profit is the calculated profit from the trade, and loss is the possible loss if stopped out. The higher the value of this coefficient, the better.
The leverage (lever) for borrowing funds is calculated by the program so that losses at the given entry price (input) and the given SL stop-loss are not greater than the allowable amount. The program assumes that this should be no more than 3% loss, taking into account commissions from any trading deposit in the specific order.
Overall, in the formation of orders there is an optimally risk-free strategy built in.
Author: Crypto_Gen21
Binance ID: 35238374
Or: USDT (TRC20) TRX Tron
TKCiF5YaMMZD2ZAk6Jrnq9b4YnjqpKLfyd
If it was helpful, then these addresses for modest thanks, exclusively after you have received your profit.