$GUA : After the Pump, Reality Sets In
GUA has had a wild move, and the chart is showing exactly why chasing green candles can be dangerous.
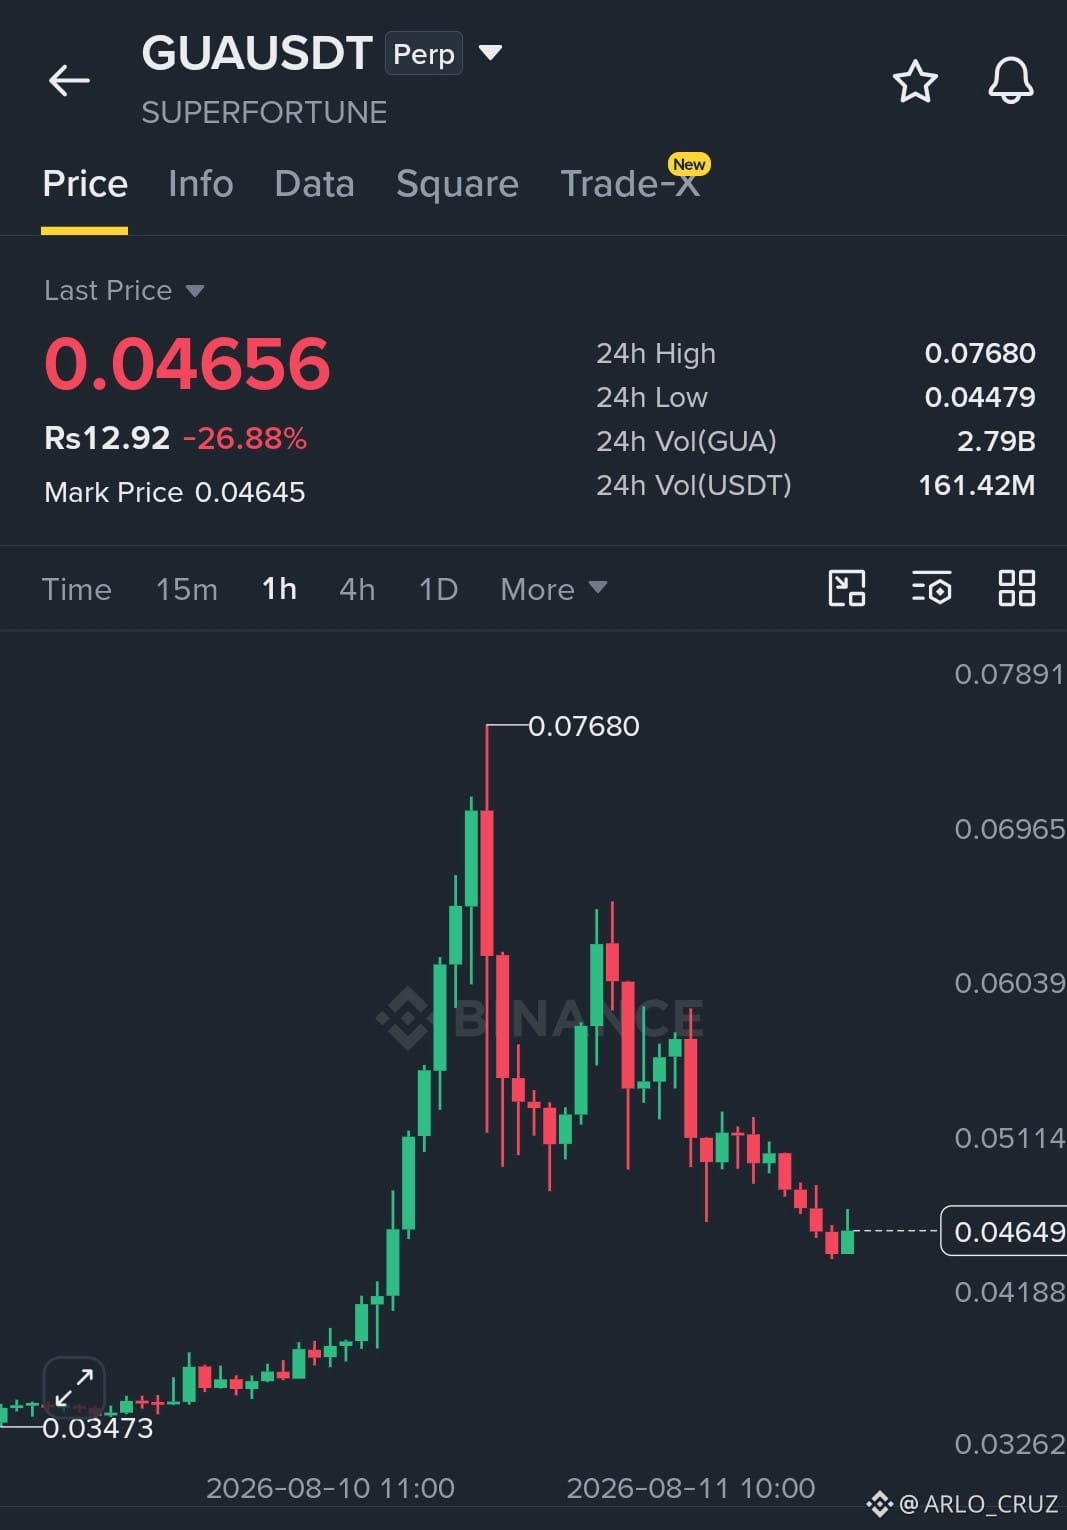
The price pushed hard from around $0.035 and eventually reached a 24-hour high of $0.07680. That was an impressive move, but the rejection from the top was just as aggressive. Now GUA is trading near $0.04656, down roughly 26.88% on the day.
What catches my attention is the structure after the spike. Instead of immediately recovering, price started forming lower highs and slowly drifting down. That tells me buyers are no longer controlling the short-term momentum the way they were during the initial breakout.
Still, I wouldn’t call the chart dead.
The $0.044–$0.045 area is becoming an important zone to watch. If buyers defend that region and price starts reclaiming $0.051, the setup could begin looking healthier again. A stronger recovery above $0.060 would be even more interesting because it could signal that momentum is returning.
On the other hand, losing the recent low would make the chart considerably weaker and could open the door to another leg down.
For me, the key lesson here is simple: volatility works both ways.
A move from $0.035 to $0.076 can create serious excitement, but the retracement can erase confidence just as quickly.
I’m watching the reaction around support rather than trying to predict the next candle. After a move this aggressive, patience matters more than hype.
#TrumpDemandsCompensationFromIran
#BlackRockCanadaLaunchesBitcoinLinkedETF
#SheinToStartHKIPOBookbuildingAsSoonAsNextWeek
#BarrickMiningFalls8%
$GUA
GUA has had a wild move, and the chart is showing exactly why chasing green candles can be dangerous.
The price pushed hard from around $0.035 and eventually reached a 24-hour high of $0.07680. That was an impressive move, but the rejection from the top was just as aggressive. Now GUA is trading near $0.04656, down roughly 26.88% on the day.
What catches my attention is the structure after the spike. Instead of immediately recovering, price started forming lower highs and slowly drifting down. That tells me buyers are no longer controlling the short-term momentum the way they were during the initial breakout.
Still, I wouldn’t call the chart dead.
The $0.044–$0.045 area is becoming an important zone to watch. If buyers defend that region and price starts reclaiming $0.051, the setup could begin looking healthier again. A stronger recovery above $0.060 would be even more interesting because it could signal that momentum is returning.
On the other hand, losing the recent low would make the chart considerably weaker and could open the door to another leg down.
For me, the key lesson here is simple: volatility works both ways.
A move from $0.035 to $0.076 can create serious excitement, but the retracement can erase confidence just as quickly.
I’m watching the reaction around support rather than trying to predict the next candle. After a move this aggressive, patience matters more than hype.
#TrumpDemandsCompensationFromIran
#BlackRockCanadaLaunchesBitcoinLinkedETF
#SheinToStartHKIPOBookbuildingAsSoonAsNextWeek
#BarrickMiningFalls8%
$GUA