Cryptocurrency markets are correcting on news that the CFTC is suing Binance and its CEO Changpeng Zhao, but technical charts are showing a glimmer of hope.

News and events related to the U.S. and European banking crises led to a shift of funds toward investments that were considered less risky. According to the Financial Times, US money market funds had inflows of US$286 billion in March.
Along with money market funds, some funds may also have filtered into the crypto industry. Increased demand may be one of the reasons why Bitcoin prices are rising
Bitcoin had a strong month in March.
The big question on cryptocurrency investors’ minds is whether the recovery will continue or if it’s time to take profits in Bitcoin.

Bitcoin holders appear confident in the long-term story and have not been enticed to sell their holdings after the recent rally. The percentage of Bitcoin supply that has been dormant since March 2021 hit an all-time high, according to Glassnode data.
If the banking crisis is contained, it could lead to a short-term correction in Bitcoin and altcoins, but any further problems with the traditional banking system will likely continue to attract investment in Bitcoin. Let’s study the charts to identify key support and resistance levels for Bitcoin and altcoins.
S&P 500 Price Analysis
The S&P 500 Index (SPX) is trading inside a descending expanding wedge pattern. The bulls attempted to push the price above the wedge on March 22, but the bears held their ground.

Buyers pushed the price above the 20-day exponential moving average (3,964) on March 27 but the long wick on the day’s candlestick suggests that the bears are in no mood to relax. Sellers will try to sink the price below the 200-day simple moving average (3,931). If they succeed, the index could drop to 3,800.
Conversely, if the bulls defend the moving averages, it will suggest demand at lower levels. The bullish momentum is likely to pick up after the buyers push the price above the resistance line of the wedge. The index could then surge to 4,200.
US Dollar Index Price Analysis
Buyers pushed the US Dollar Index (DXY) above the 20-day exponential moving average (103) on March 15 but failed to continue rising after the breakout. This suggests that bears are selling on rallies.

The index could drop to the strong support at 100.82, where the bulls will try to stop the decline. If the price rebounds from this level and rises above the 20-day EMA, it will suggest that the index might remain range bound between the 200-day EMA (106) and 100.82 for a while.
A break below the 100.82 level will be a huge negative as it will complete a bearish head and shoulders (H&S) pattern. The index could then plummet to 95. On the upside, a break above the 200-day moving average could push the price to the 61.8% Fibonacci retracement level of 108.43.
Bitcoin Price Analysis
Bitcoin has not been able to rise above $29,000 in the past few days, but the bulls continue to remain strong. They did not even allow the price to drop to the breakout level of $25,250.
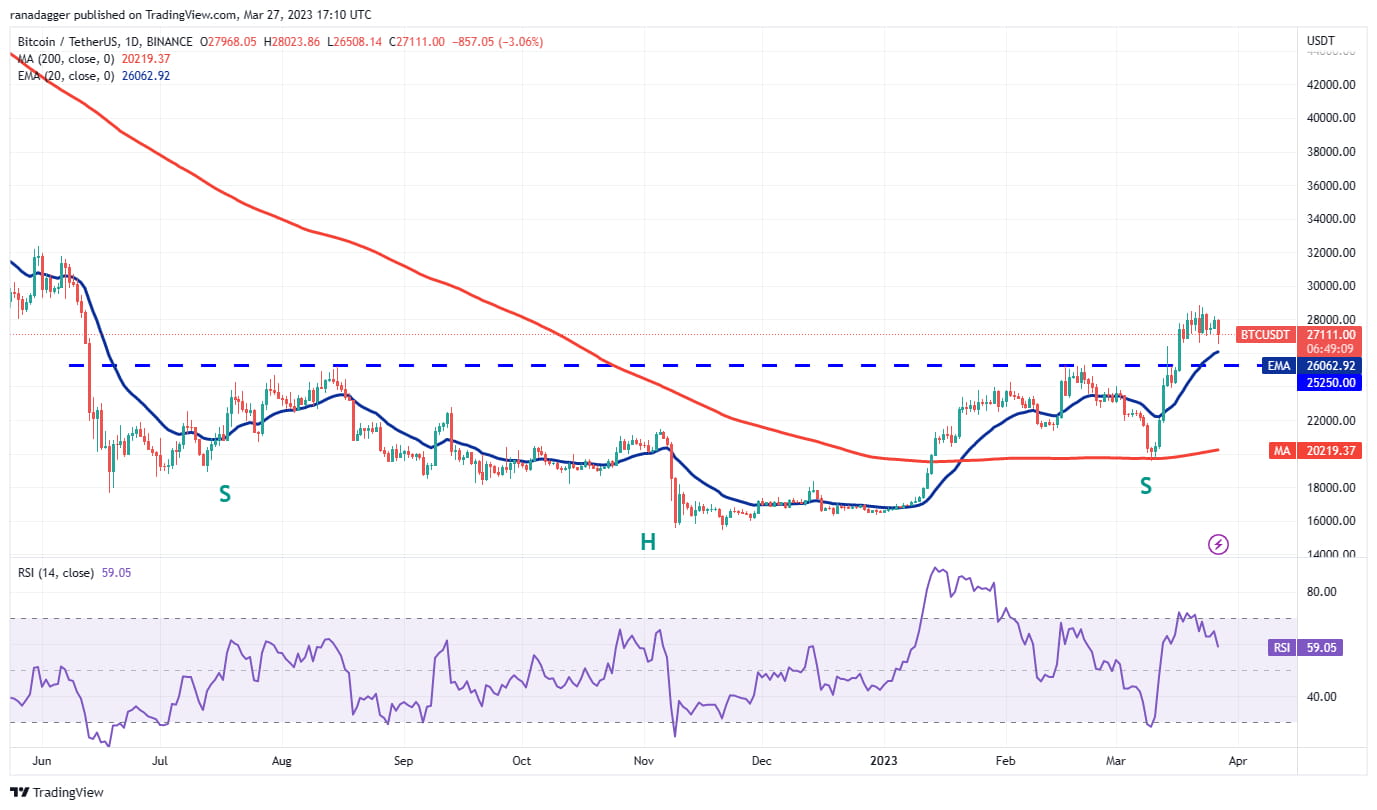
The upsloping 20-day EMA ($26,062) and the relative strength index (RSI) in the positive territory suggest that the path of least resistance is to the upside.
If the bulls push the price above $29,000, the BTC/USDT pair could quickly climb to $32,500. This level could witness aggressive selling by the bears, but if the buyers overcome this hurdle, the pair could surge to $40,000.
This positive view may be invalidated in the short term if the price breaks below $25,250. The bolder bears will then try to sink the pair to the 200-day EMA ($20,219).
Ethereum Price Analysis
Ethereum
There was a rebound from the 20-day EMA ($1,705) on March 25, but the bulls could not challenge the overhead resistance at $1,857. This suggests selling by the bears on the relief rally.

The bears will once again try to sink the price below the 20-day EMA and the horizontal support at $1,680. If they succeed, the ETH/USDT pair could drop to $1,600. This is an important level for the bulls to defend because if this support cracks, the pair could drop to the 200-day SMA ($1,435).
Alternatively, if the price rebounds off the 20-day EMA, it will suggest that the bulls continue to buy on dips. The pair could then rally to the overhead resistance of $1,857. If this hurdle is crossed, the pair could jump to $2,000 and then to $2,200.
BNB Price Analysis
Binance Coin rebounded from the 20-day EMA ($317) on March 25, but the bulls could not clear the downtrend line, which shows that bears are selling on every minor rebound.

The bears have pulled the price below the 20-day EMA. If they manage to sustain lower levels, the BNB/USDT pair could plummet to the 200-day SMA ($290). This is an important level to watch out for because if it capitulates, the pair could plummet to $265.
The first sign of strength will be a breakout and close above the downtrend line. This will indicate aggressive buying at lower levels. The pair might then try to rally towards the $338–$346 resistance area.
Ripple Price Analysis
Bulls push moving averages towards support and attempt to resume XRP’s recovery
Ripple
. However, higher levels are attracting aggressive selling as seen from the long wick on the March 27 candlestick.

The bears will once again try to pull the XRP/USDT pair to the moving averages. If the price rebounds off the 20-day EMA ($0.41), it will suggest that buyers are accumulating at lower levels. The bulls are then likely to make another attempt to clear the upper zone. If that happens, the pair can rally to $0.65 and eventually to $0.80.
On the other hand, if the price breaks down of the moving averages, it will indicate that the bears are back in control. The pair can then drop to $0.36.
Cardano Price Analysis
Cardano
It broke below the 200-day SMA ($0.36) and touched the 20-day EMA ($0.35) on March 25. The bulls attempted a rebound on March 26, but the rally was weak.

The bears will try to sustain the price below the 20-day EMA. If they manage to do that, it will suggest that the recent rebound above the 200-day SMA might be a bull trap. The ADA/USDT pair could drop to $0.32 first and then to $0.30.
Conversely, if the price rises and breaks out of the 200-day EMA, it will indicate demand at lower levels. The bulls will then again try to push the price to the neckline of the inverse H&S pattern.
Polygonal Price Analysis
Polygonal Matic
The minor rebound from the strong support of $1.05 on March 25 shows a lack of aggressive buying by the bulls. The bears are trying to consolidate their positions by sinking the price below $1.05.

If the bears sustain the decline, the MATIC/USDT pair could drop to the 200-day SMA ($0.97). This is an important level to watch closely because if it gives in, the sentiment will turn negative and the pair could drop to $0.69.
If the bulls want to arrest this decline, they will have to quickly push the price back above the 20-day EMA ($1.13). This will increase the possibility of a rally to the strong overhead resistance area between $1.25 and $1.30.
Dogecoin Price Analysis
Dogecoin
It has been oscillating between the 200-day SMA ($0.08) and the horizontal support at $0.07 for the past few days.

The flat 20-day EMA ($0.07) and the RSI just below the midpoint do not give a clear advantage to either the bulls or the bears. This suggests that the DOGE/USDT pair might spend more time inside the range. The longer it stays inside the range, the higher the probability of an eventual breakout from it.
If the price breaks below $0.07, the pair could extend the decline to $0.06 and then to the important support near $0.05. Conversely, if the price breaks above the 200-day SMA, the pair could surge to the $0.10–$0.11 resistance zone.
Solana Price Analysis
Solana Sol
It declined below the 20-day EMA ($20.93) on March 24. The buyers tried to push the price back above the 20-day EMA on March 25 and 26, but the bears held their ground. This suggests that the bears are trying to turn the 20-day EMA into a resistance.

If the price sustains below $20, the SOL/USDT pair might retest the immediate support of $18.70. This level is likely to attract buying, but if the bulls fail to push the price above the 20-day EMA, the possibility of a drop to $15.28 increases.
Contrary to this assumption, if the price turns up from the current levels and rises above the downtrend line, it will indicate that the downtrend might be over. The pair might first rise to $27 and then attempt a rally to $39.
C3 Tip: The views, thoughts and opinions expressed here are the author's own and do not constitute investment advice or recommendations. Every investment and transaction involves risk.


