$MUBARAK
*Summary of MUBARAK/USDT from the two photos*
*1. Current price situation*
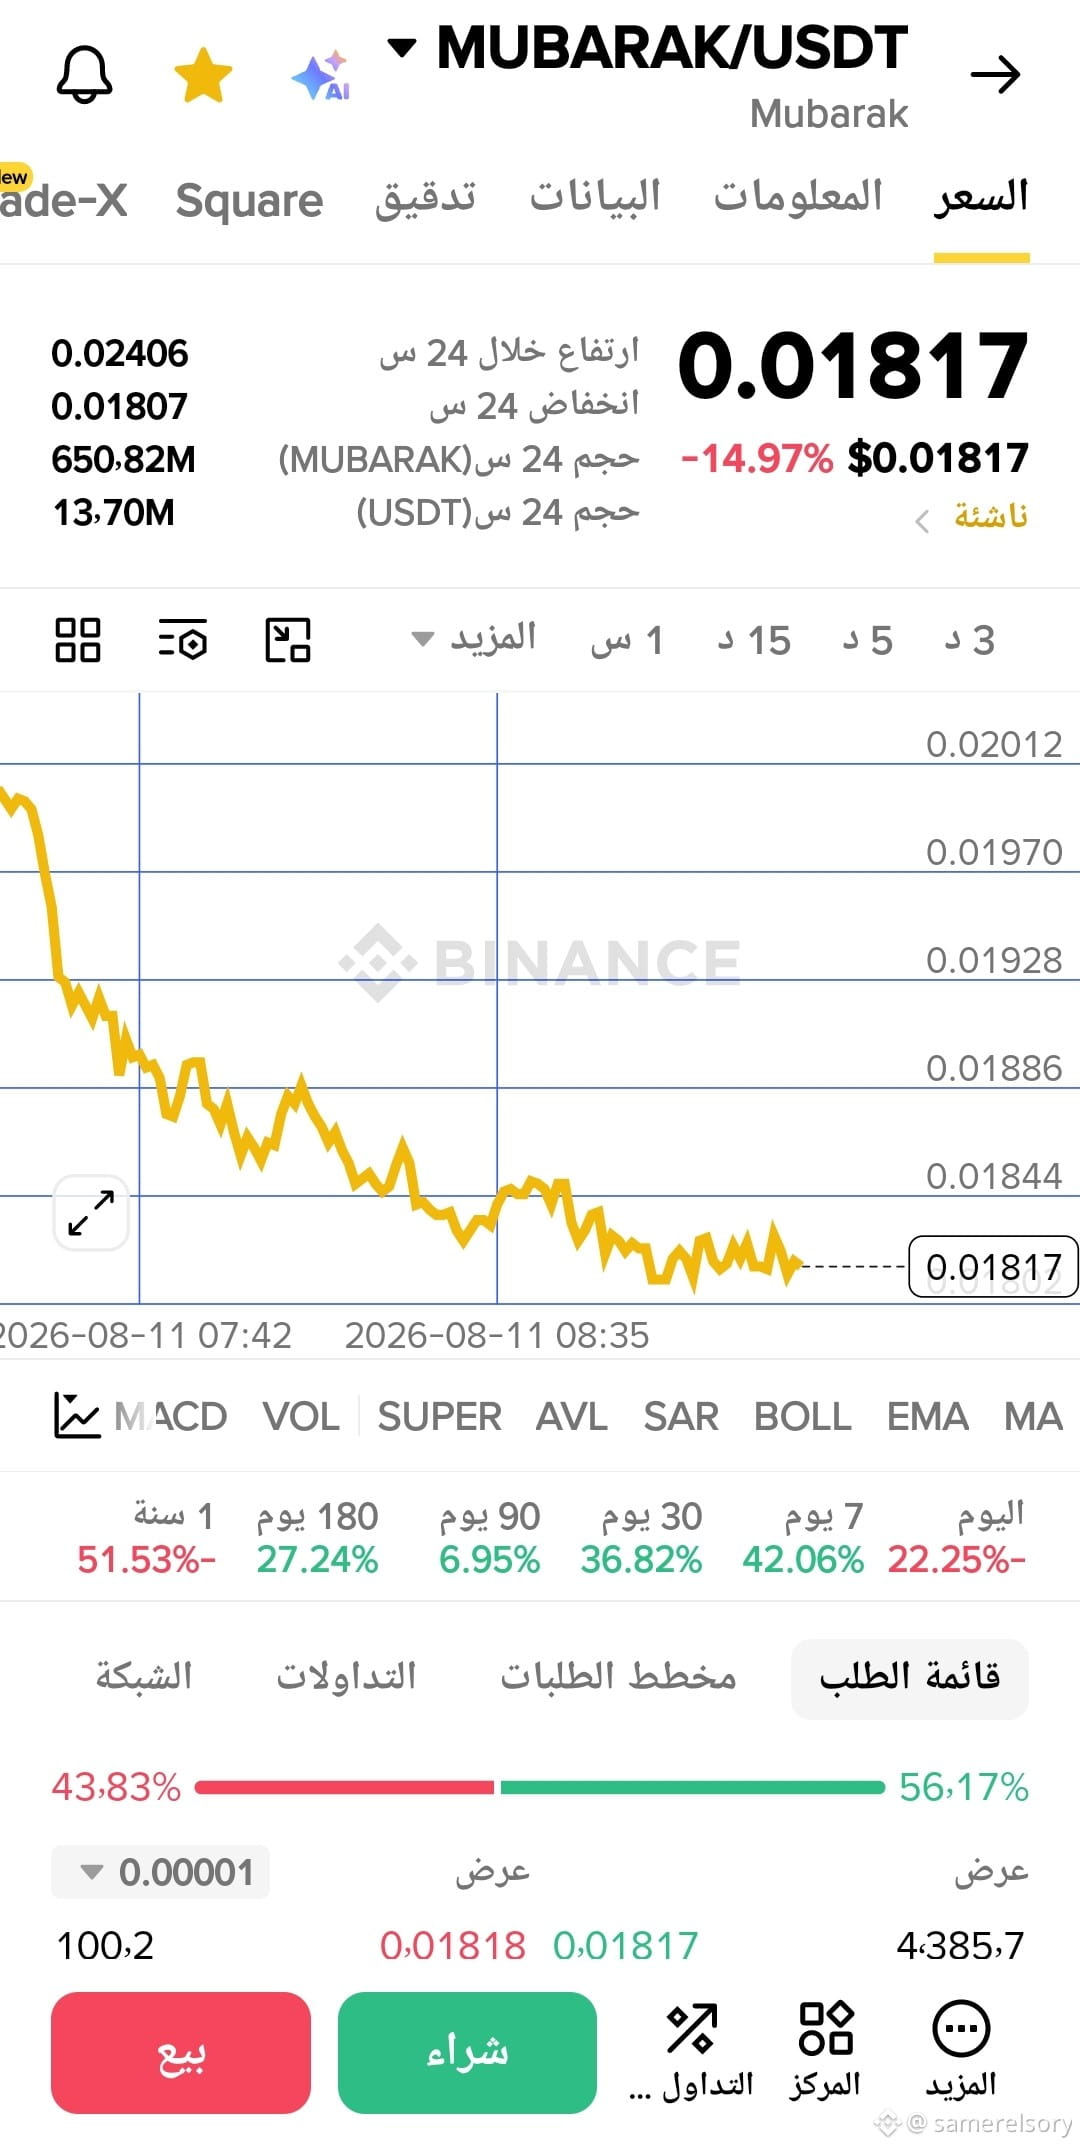
- *Price*: 0.01817 ~ 0.01818
- *24h change*: -14.97% to -21.16%
- *24h high*: 0.02406
- *24h low*: 0.01807
- *24h volume*: 650.82M MUBARAK / 13.70M USDT
*2. Breakout & resistance points*
1. *0.01844* - first immediate resistance
2. *0.01886* - nearby resistance
3. *0.01928 - 0.01970* - medium resistance
4. *0.02012* - strong resistance. Breaking above it and holding = it could change the bearish trend
*3. Downside & support points*
1. *0.01807* - the 24h lowest price. This is direct support
2. *0.01780 - 0.01750* - if 0.01807 is broken, price may move into these zones
*4. Chart movement expectations*
- *Trend*: strong bearish. Dropped from 0.02012 to 0.01817 in one large candle, then became sideways
- *Momentum*: rebound attempts fail below 0.01844. There is no strong bullish candle yet
- *Scenario*:
- As long as it stays below 0.01844 = continuous selling pressure
- Break below 0.01807 = continuation of the downtrend
- Holding above 0.01886 + 0.01928 = the start of a rebound
*5. Quick coin data*
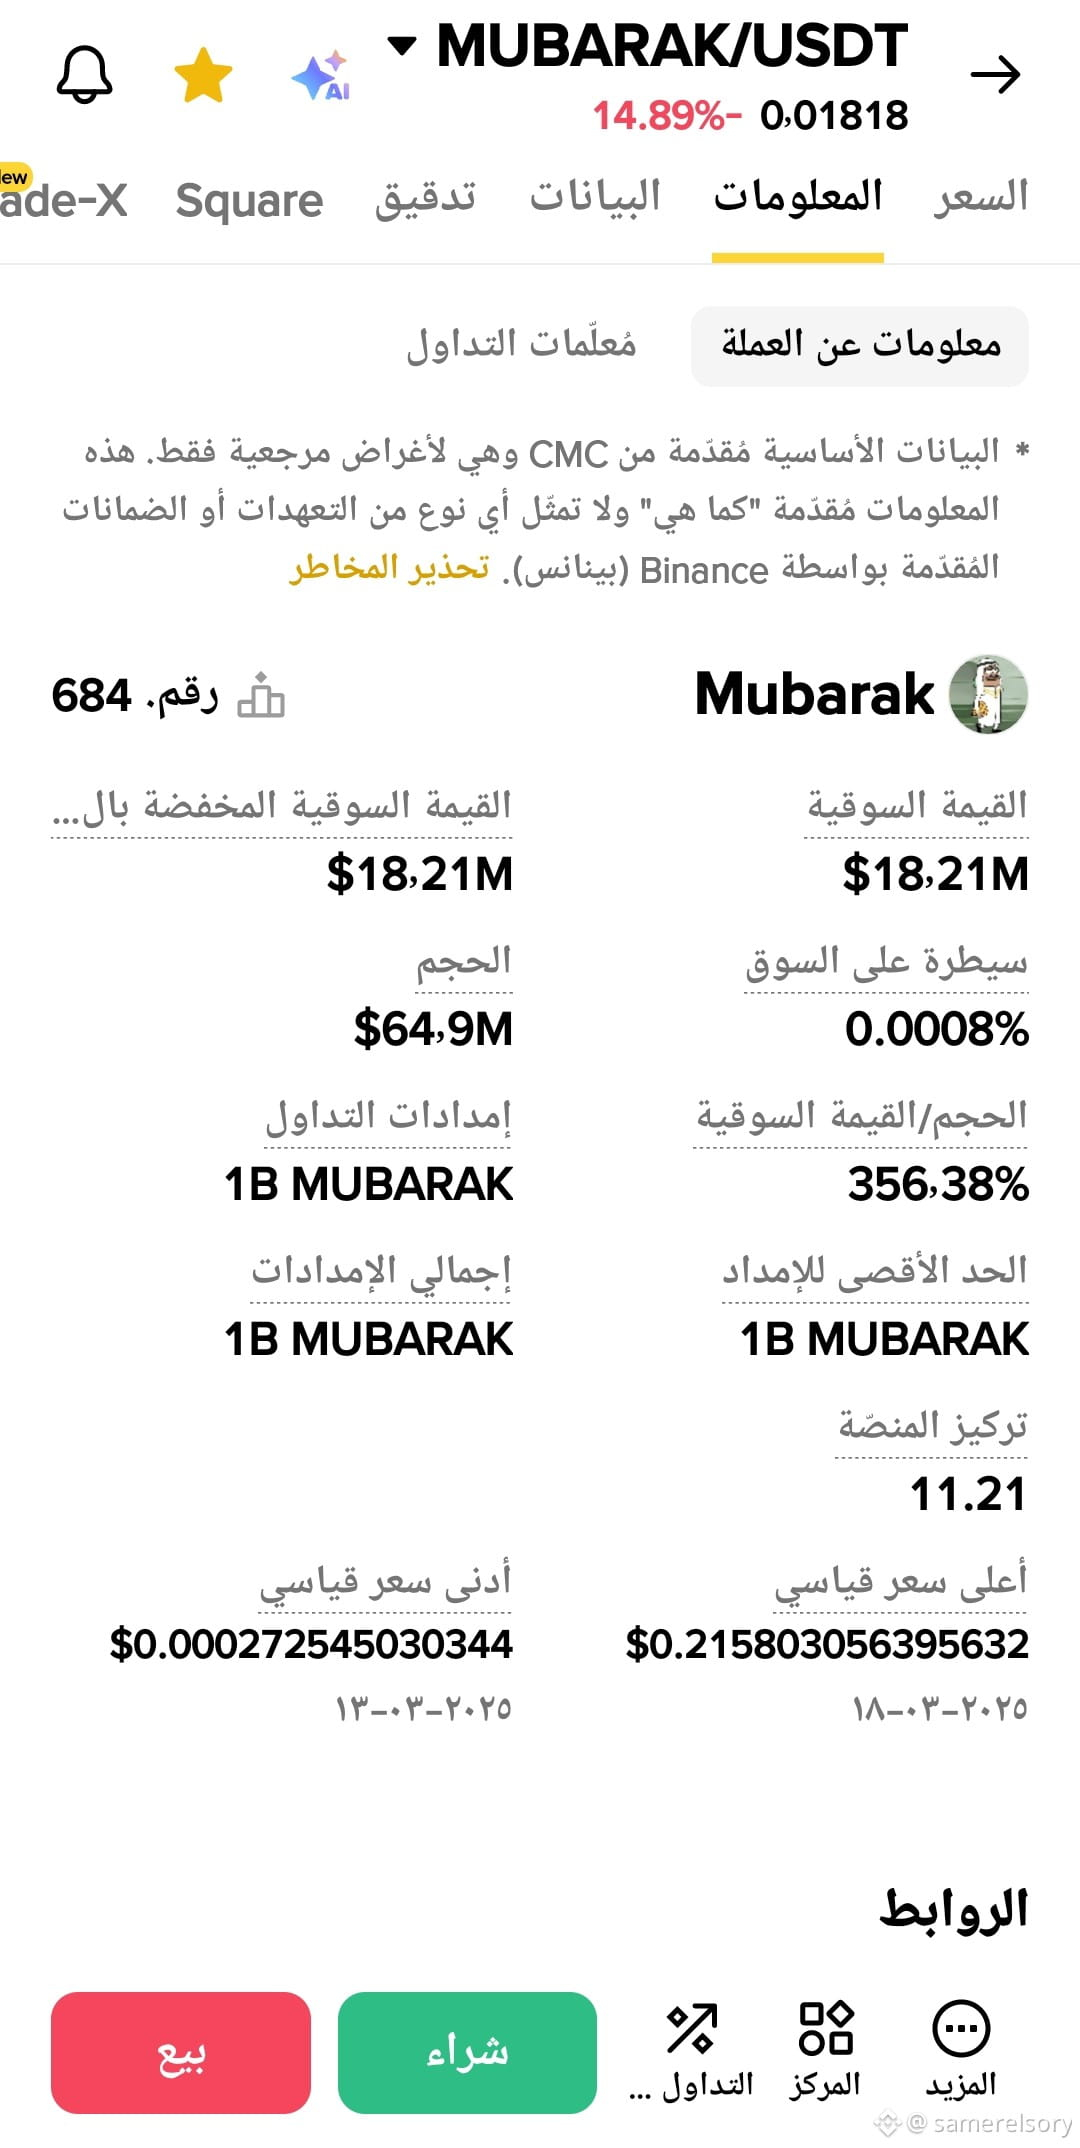
- *Rank*: 684 on CMC
- *Market cap*: $18.21M
- *Total supply*: 1B MUBARAK - all is circulating
- *All-time high*: $0.2158 on 18-02-2025
- *All-time low*: $0.00027 on 13-02-2025
- *Platform focus*: 11.21
Conclusion: The price is still in a downtrend wave and is trapped between 0.01807 support and 0.01844 - 0.01886 resistance.
Do you want me to keep following with you if it breaks any of those points?
*Summary of MUBARAK/USDT from the two photos*
*1. Current price situation*
- *Price*: 0.01817 ~ 0.01818
- *24h change*: -14.97% to -21.16%
- *24h high*: 0.02406
- *24h low*: 0.01807
- *24h volume*: 650.82M MUBARAK / 13.70M USDT
*2. Breakout & resistance points*
1. *0.01844* - first immediate resistance
2. *0.01886* - nearby resistance
3. *0.01928 - 0.01970* - medium resistance
4. *0.02012* - strong resistance. Breaking above it and holding = it could change the bearish trend
*3. Downside & support points*
1. *0.01807* - the 24h lowest price. This is direct support
2. *0.01780 - 0.01750* - if 0.01807 is broken, price may move into these zones
*4. Chart movement expectations*
- *Trend*: strong bearish. Dropped from 0.02012 to 0.01817 in one large candle, then became sideways
- *Momentum*: rebound attempts fail below 0.01844. There is no strong bullish candle yet
- *Scenario*:
- As long as it stays below 0.01844 = continuous selling pressure
- Break below 0.01807 = continuation of the downtrend
- Holding above 0.01886 + 0.01928 = the start of a rebound
*5. Quick coin data*
- *Rank*: 684 on CMC
- *Market cap*: $18.21M
- *Total supply*: 1B MUBARAK - all is circulating
- *All-time high*: $0.2158 on 18-02-2025
- *All-time low*: $0.00027 on 13-02-2025
- *Platform focus*: 11.21
Conclusion: The price is still in a downtrend wave and is trapped between 0.01807 support and 0.01844 - 0.01886 resistance.
Do you want me to keep following with you if it breaks any of those points?