Candlestick patterns on a 5-minute chart: basics for beginners 📈📉📈
If you’re just starting to trade, begin by understanding candlestick patterns—they help you “read” market sentiment and make decisions.
💡 What is a candlestick?
Each candlestick on the chart shows price movement over 5 minutes. It has:
- Body — the difference between the opening and closing prices
- Shadows — show the highs and lows
Color:
🔴 Red — the price fell.
🟢 Green — the price rose.
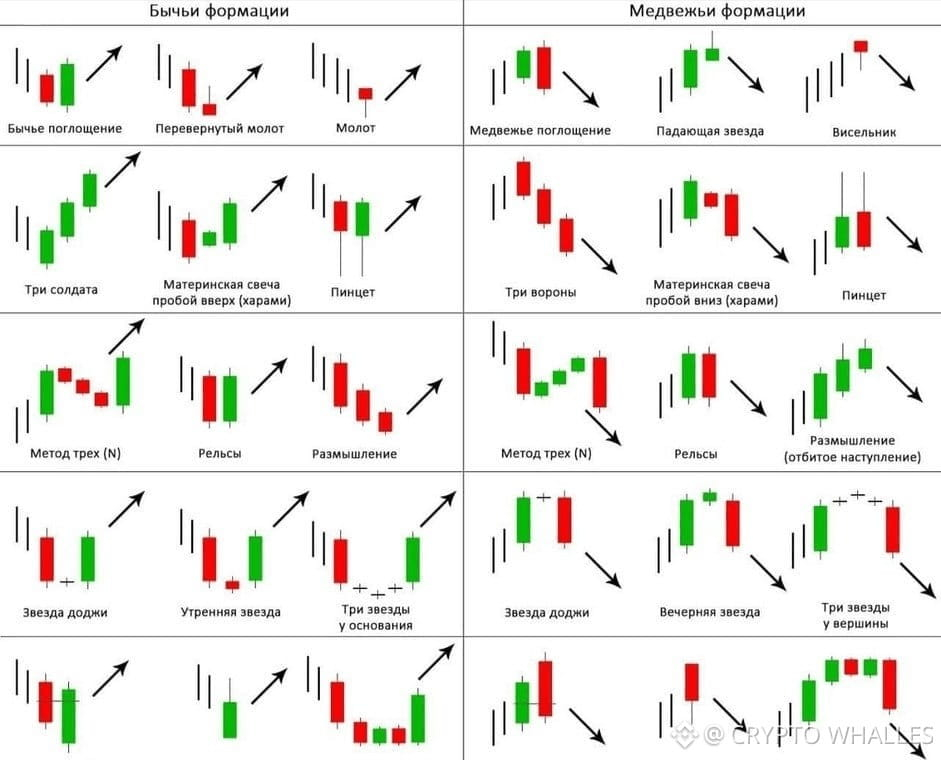
- Popular candlestick patterns:
1. Engulfing — a strong reversal, especially after a trend.
2. Hammer — a signal of possible growth after a decline.
3. Hanging Man — a possible reversal downward.
4. Doji — indecision; it can be a reversal signal.
5. Three Soldiers / Three Crows — trend continuation (up or down).
- These patterns are especially useful on 5-minute charts for scalping and short-term trades. The main thing is: don’t trade blindly—look at volume, trends, and confirmations.
#patterns #BTC☀ #Squar2earn
If you’re just starting to trade, begin by understanding candlestick patterns—they help you “read” market sentiment and make decisions.
💡 What is a candlestick?
Each candlestick on the chart shows price movement over 5 minutes. It has:
- Body — the difference between the opening and closing prices
- Shadows — show the highs and lows
Color:
🔴 Red — the price fell.
🟢 Green — the price rose.
- Popular candlestick patterns:
1. Engulfing — a strong reversal, especially after a trend.
2. Hammer — a signal of possible growth after a decline.
3. Hanging Man — a possible reversal downward.
4. Doji — indecision; it can be a reversal signal.
5. Three Soldiers / Three Crows — trend continuation (up or down).
- These patterns are especially useful on 5-minute charts for scalping and short-term trades. The main thing is: don’t trade blindly—look at volume, trends, and confirmations.
#patterns #BTC☀ #Squar2earn