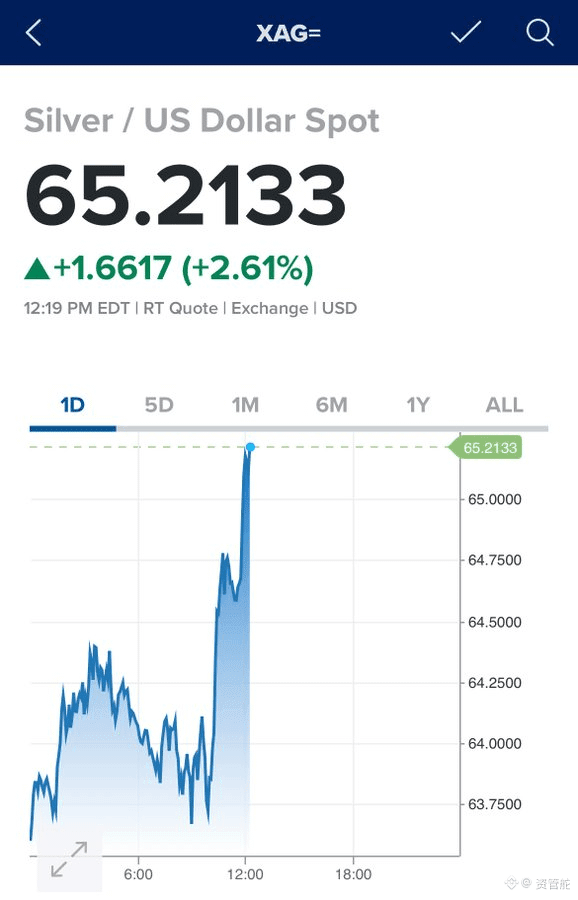
Silver has reached $65.21.
Up 2.61% intraday: it was pulled from around $63.5 to $65.2, with that big vertical surge around just before/around 12 o’clock accounting for most of the gain. This kind of move usually isn’t something retail traders can push on their own. Behind the volume, there’s typically institutional or algorithmic trading driving it.
When you compare this chart with the one earlier—the 50-year logarithmic chart—it gets interesting. On the long-term chart, silver is now pressing up against a trendline resistance that has been in play since 1970. On the short-term side, it has already started to “run ahead.” The $65 level also acted as resistance during that spike in April 2024. If it can break above with strong volume, upside room could open up quickly.
A few practical points:
1) Be cautious about chasing price intraday. After a vertical surge, there’s often a follow-through profit-taking pullback. Waiting for a confirmed retest of support before entering is generally safer than buying the green candle.
2) If the $64–$64.5 range is retested but holds (i.e., doesn’t break), it suggests the short-term bullish structure is still intact. If it breaks, you’ll need to reassess.
3) Silver’s “temper” is usually to stay flat for years and then complete moves worth years of gains in just a few months. Once the long-term trendline resistance is broken effectively (note: “effectively,” not just a touch and then falling back), the speed and magnitude of the advance will very likely exceed most people’s expectations.
It’s still too early to say “breakout” for sure, but price action is already sending signals. Watch whether it can hold above $65.
Up 2.61% intraday: it was pulled from around $63.5 to $65.2, with that big vertical surge around just before/around 12 o’clock accounting for most of the gain. This kind of move usually isn’t something retail traders can push on their own. Behind the volume, there’s typically institutional or algorithmic trading driving it.
When you compare this chart with the one earlier—the 50-year logarithmic chart—it gets interesting. On the long-term chart, silver is now pressing up against a trendline resistance that has been in play since 1970. On the short-term side, it has already started to “run ahead.” The $65 level also acted as resistance during that spike in April 2024. If it can break above with strong volume, upside room could open up quickly.
A few practical points:
1) Be cautious about chasing price intraday. After a vertical surge, there’s often a follow-through profit-taking pullback. Waiting for a confirmed retest of support before entering is generally safer than buying the green candle.
2) If the $64–$64.5 range is retested but holds (i.e., doesn’t break), it suggests the short-term bullish structure is still intact. If it breaks, you’ll need to reassess.
3) Silver’s “temper” is usually to stay flat for years and then complete moves worth years of gains in just a few months. Once the long-term trendline resistance is broken effectively (note: “effectively,” not just a touch and then falling back), the speed and magnitude of the advance will very likely exceed most people’s expectations.
It’s still too early to say “breakout” for sure, but price action is already sending signals. Watch whether it can hold above $65.