



This person with an Einstein hairstyle is one of the few traders who have achieved significant results in both the forex and cryptocurrency markets. Starting with an account of only $3000, he is now able to consistently profit over $50,000 every month, with over six hundred thousand followers online.
He is Mayne, the co-founder of the self-operated trading company Breakout, which was acquired by the exchange.
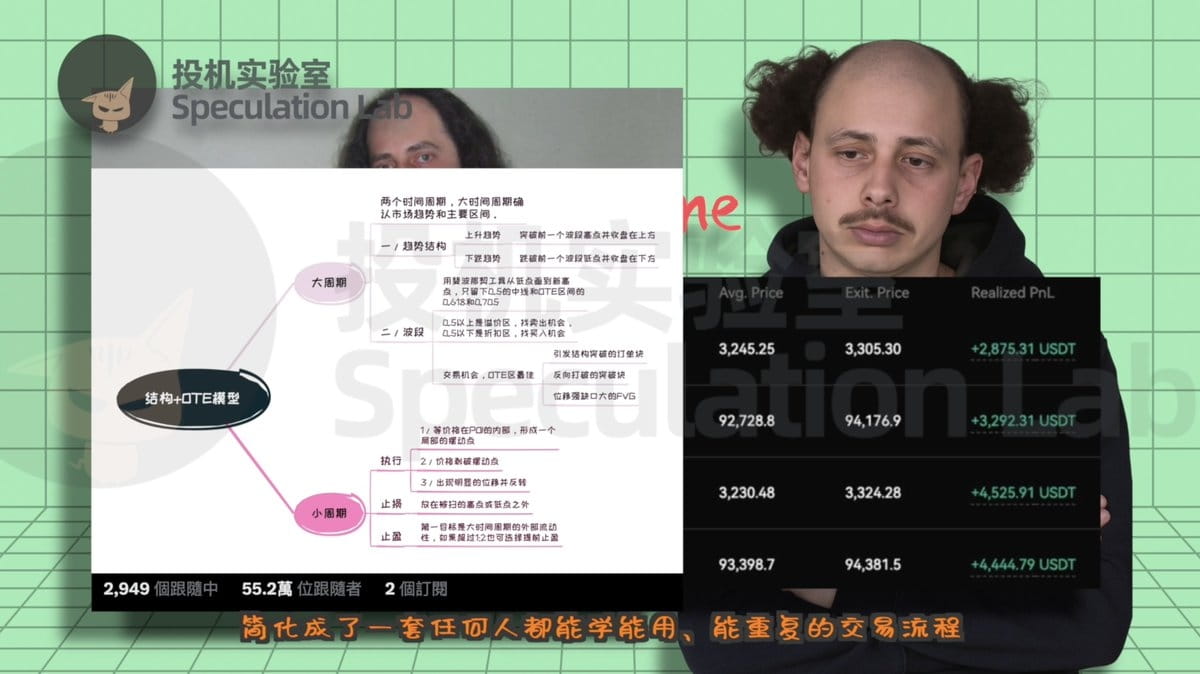
Recently, he publicly shared his trading system specifically designed for the cryptocurrency market, structured with the OTE wave model, where OTE means optimal trade entry. This simplifies the complex ICT theory into a set of trading processes that anyone can learn, use, and repeat. Whether you are a beginner or a trader with many years of experience, this model can help you capture high-probability trading opportunities.
The framework involves two time frames: larger time frames such as weekly, daily, or four-hour charts for confirming market trends and major ranges, identifying equal highs or lows—these are external liquidity. Smaller time frames such as one hour, fifteen minutes, or five minutes are used to find entry points in key internal areas, such as order blocks, breakout blocks, and FVGs.
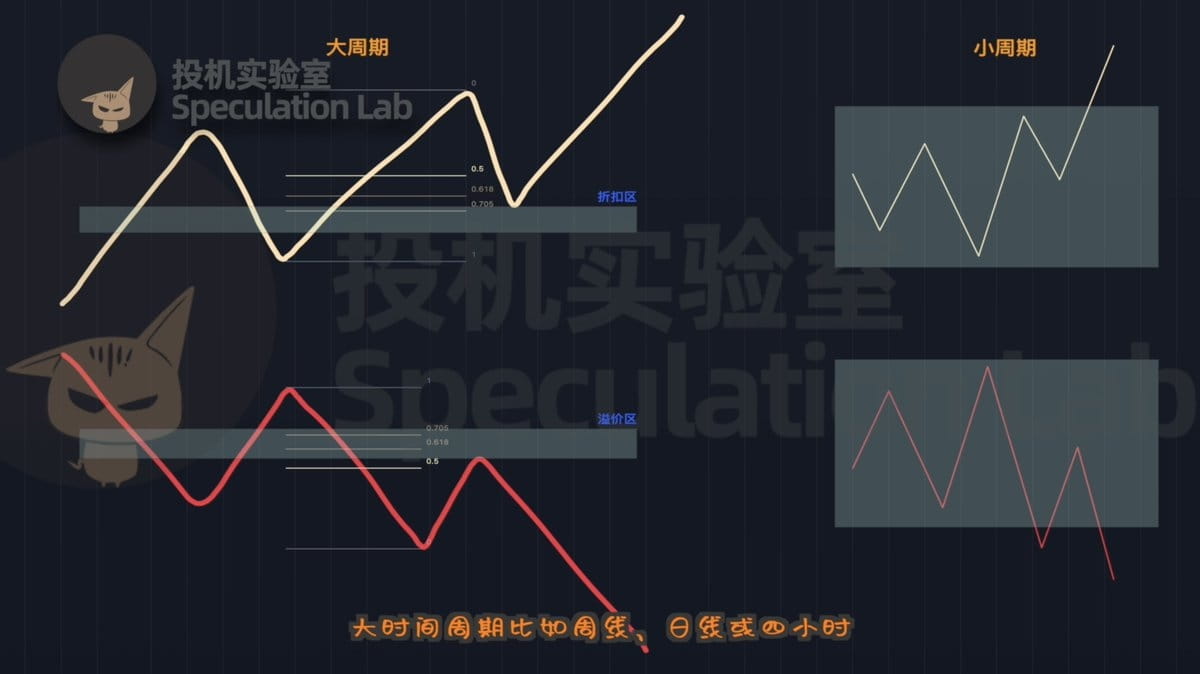
Mayne believes that usually, the market first sweeps away external liquidity, clearing a batch of stop losses, then returns to internal liquidity to provide trading opportunities. The role of smaller time frames is to find entry signals during structural retracements.
The first step to entering a trade is to confirm the trend structure and determine whether the trend is continuing or reversing, which depends on whether the structure has been broken. In the ICT system, structural breakage is a signal for trend recovery. In an uptrend, if the price breaks the previous wave's high and closes above it, in a downtrend, if the price breaks the previous wave's low and closes below it, it indicates trend continuation.
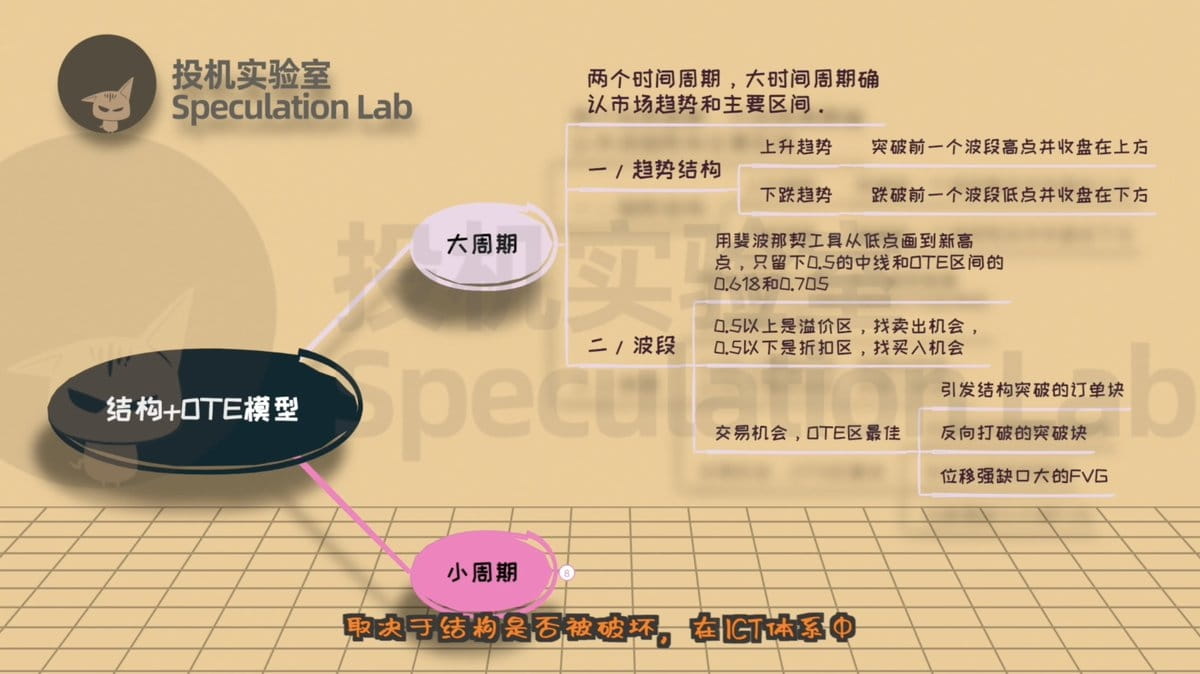
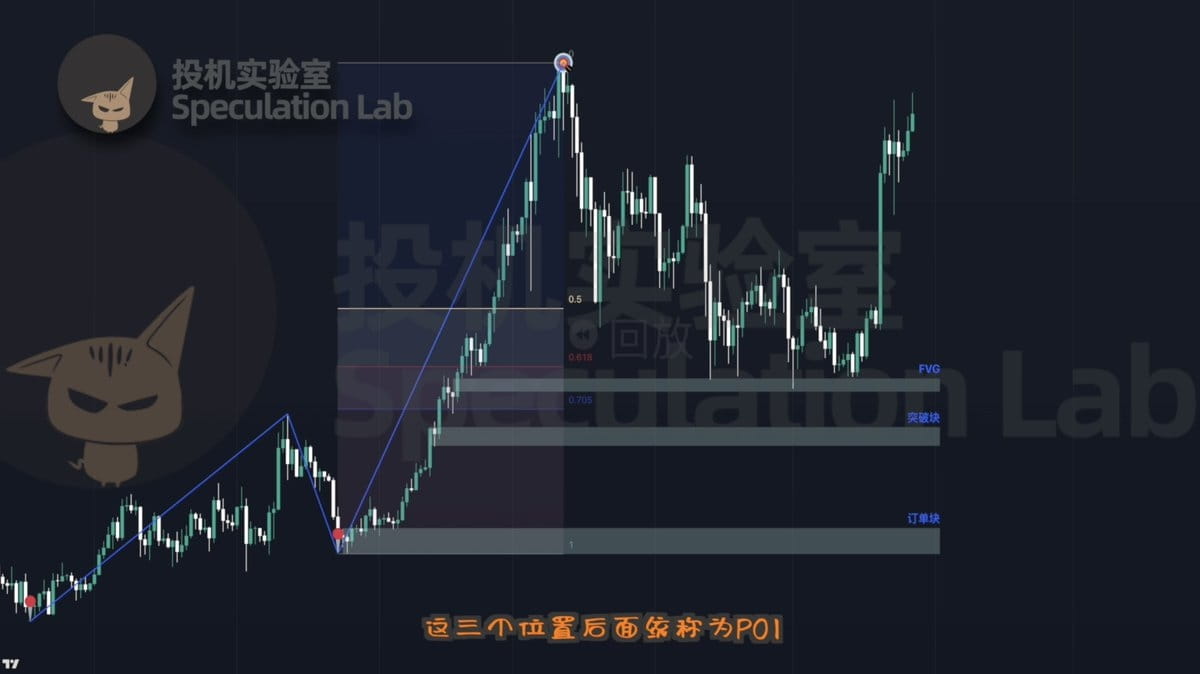
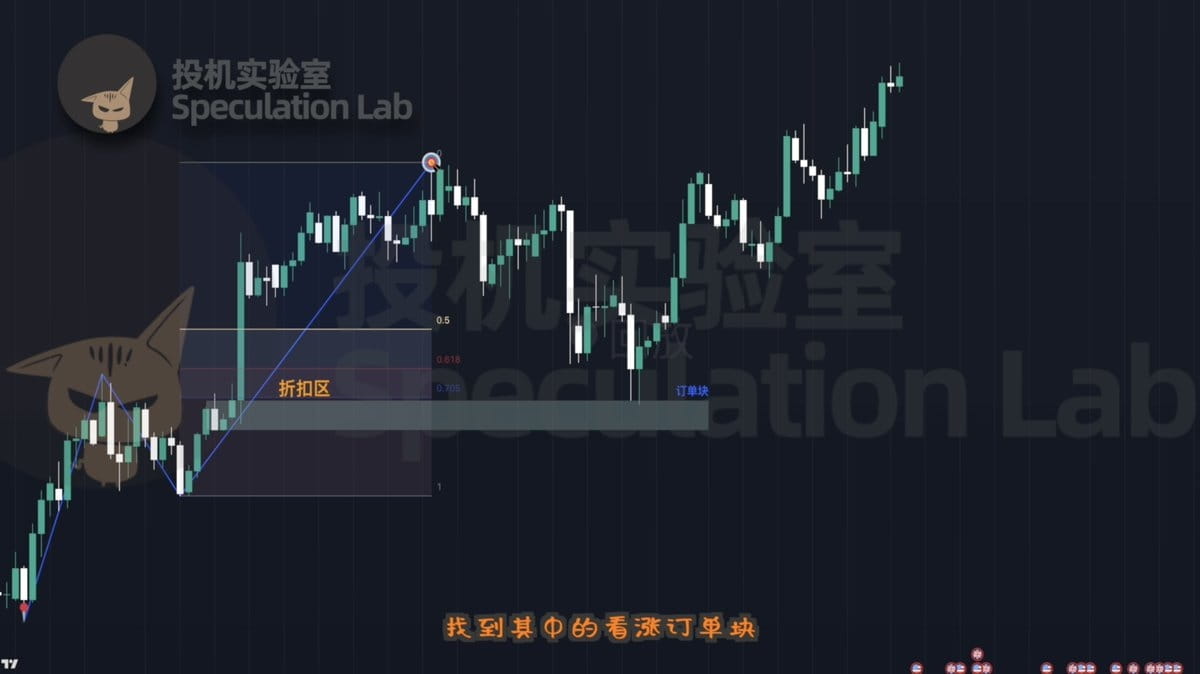
The second step is to delineate the wave range on a larger time frame, marking the most recent wave. Use the Fibonacci tool to draw from the low point to the new high, leaving only the 50% midline and the commonly used ICT OTE ranges of 0.618 and 0.705. Areas above 50% are premium zones that provide selling opportunities, while areas below 50% are discount zones that provide buying opportunities.
Trading opportunities mainly focus on three positions within the range: first, the order block that triggers the structural breakout, which has the highest priority. Second, the breakout block that is often retested after being broken in the opposite direction. Third, the strong displacement with a large fair value gap (FVG), which reflects the actions of large funds pushing the price; this is a strong signal and an additional factor. These three positions are collectively referred to as POI.
The third step is to execute the trade. When the price enters the POI, switch to a smaller time frame and start waiting for confirmation signals. The process is very mechanical: first, wait for the price to be inside the POI and form a local swing point. Then, wait for the price to break this point, clearing the stop losses of early entry funds, completing liquidity sweep. Note that if the swept swing point is broken again, it indicates the model has failed. Finally, check for obvious displacement accompanied by a reversal. Ideally, a small time frame FVG appears at the same time, and we can enter at the new POI location.
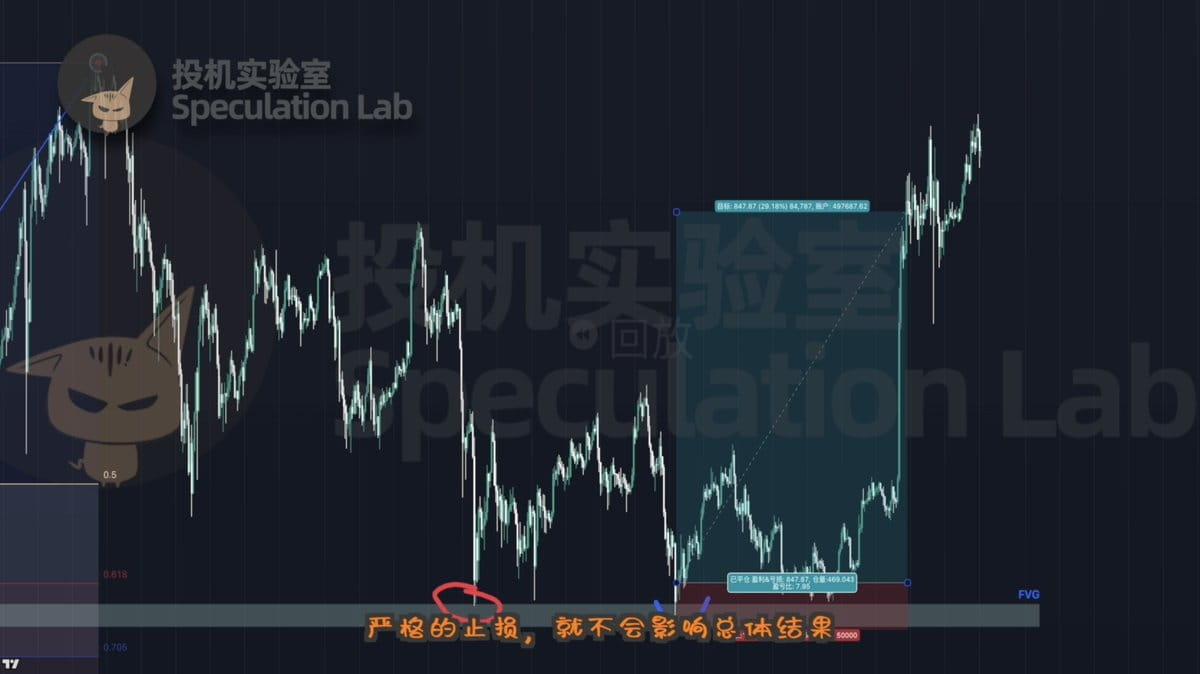
Stop losses should be placed outside the swept high or low points, and the first target for taking profit is always the external liquidity of the larger time frame, which is the high or low point of the previous wave. If the expected risk-reward ratio is less than 1:2, the trade should be abandoned. When the trend direction of larger and smaller time frames is consistent, the signal weight can be higher; if the directions are inconsistent, the position should be reduced. When nearing a risk-reward ratio of 1:2, one can choose to reduce the position or move the stop loss to the break-even point. Whether to lock in profits early depends on your confidence in the model. It is also normal to encounter one or two false signals during trading as long as the risk-reward ratio is good and the stop loss is strict; it won’t affect the overall result. After each trade, you can review it in order as shown in the chart and summarize your experience.
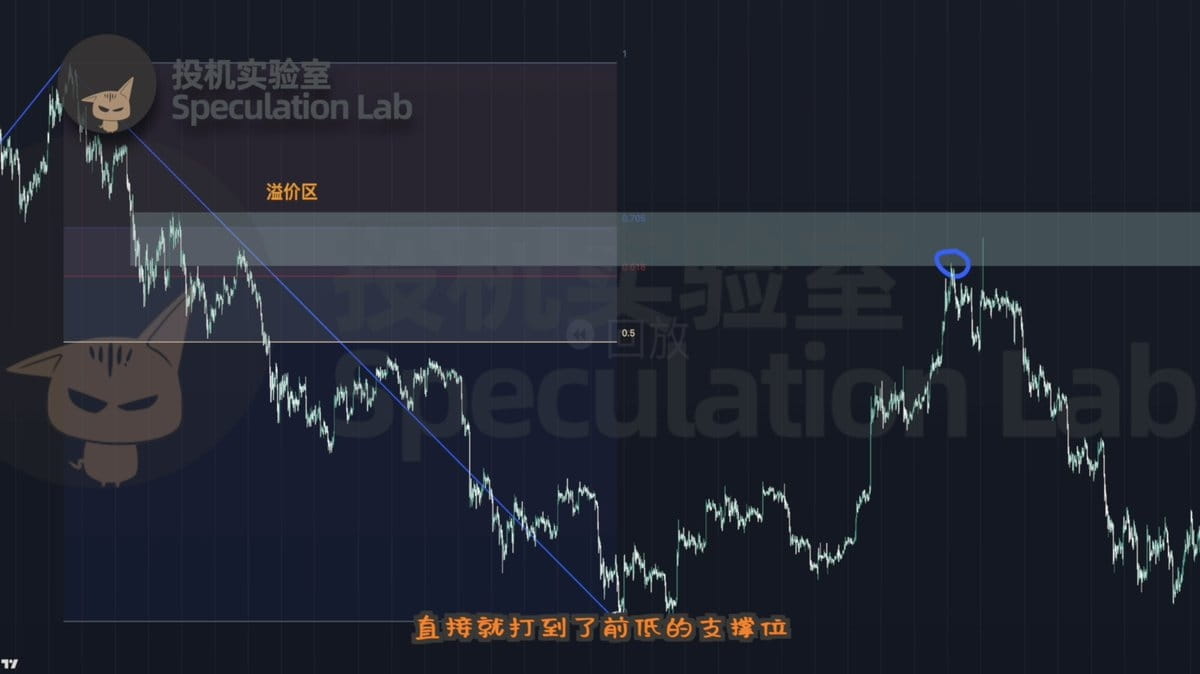
Looking at this short position, first on the two-day chart, the market structure has clearly turned bearish. Mark the high and low points of the wave and use these two anchor points to draw the premium zone, where we will look for selling opportunities. Next, find a bearish order block within the premium zone; this is the last major sell-off from the previous upward push.
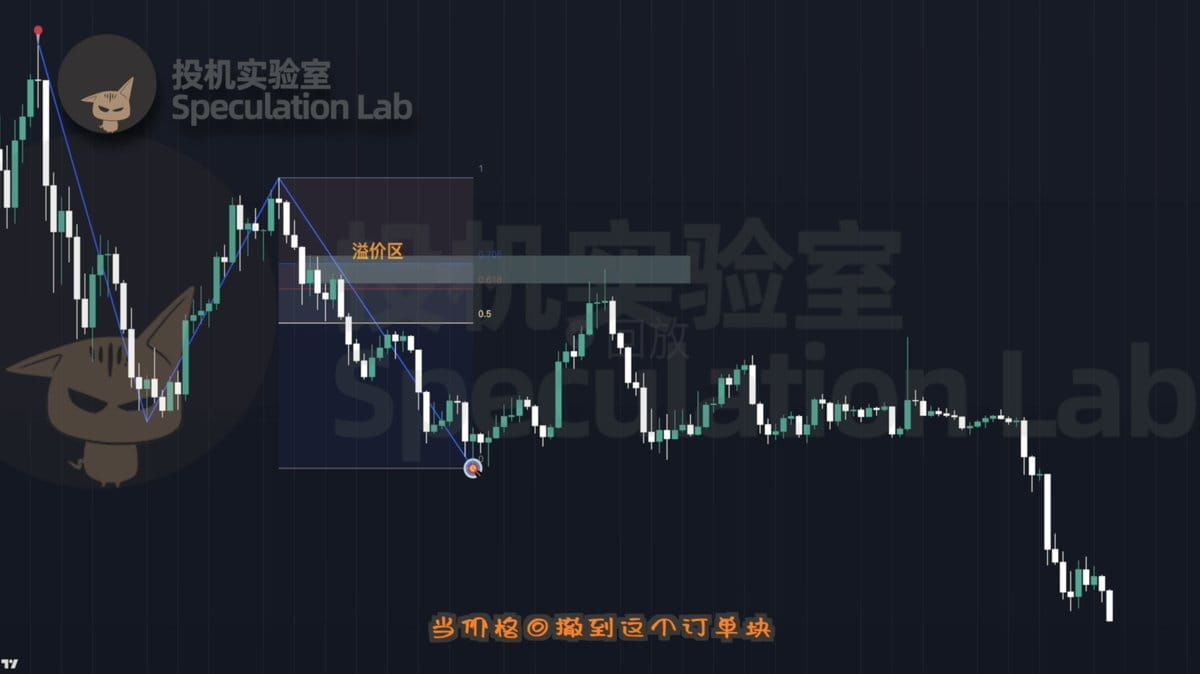
When the price retraces to this order block, we switch to the 1-hour chart. It can be seen that the price first swept away the liquidity of the previous high, attracting retail funds to chase long positions. Subsequently, the price reverses downwards, showing clear structural breakage, and a strong displacement occurs, leaving a significant fair value gap (FVG), indicating that large funds are pushing the price down. The price then moves down accordingly, directly hitting the support level of the previous low.
 Looking at this long position on the weekly level, Solana has formed a standard bullish structure, with the trend showing higher highs and higher lows. First, we delineate the wave on the larger time frame to determine the discount zone. Within this zone, we find a strong bullish order block and wait for the price to retrace to here when it enters the order block.
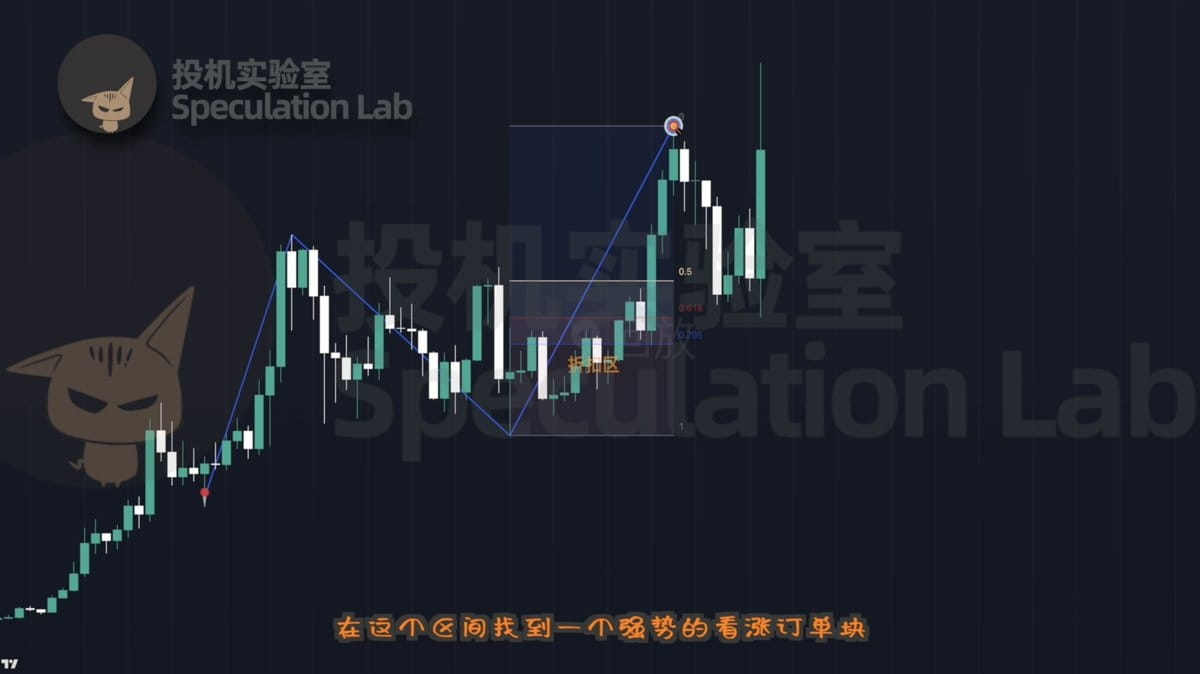
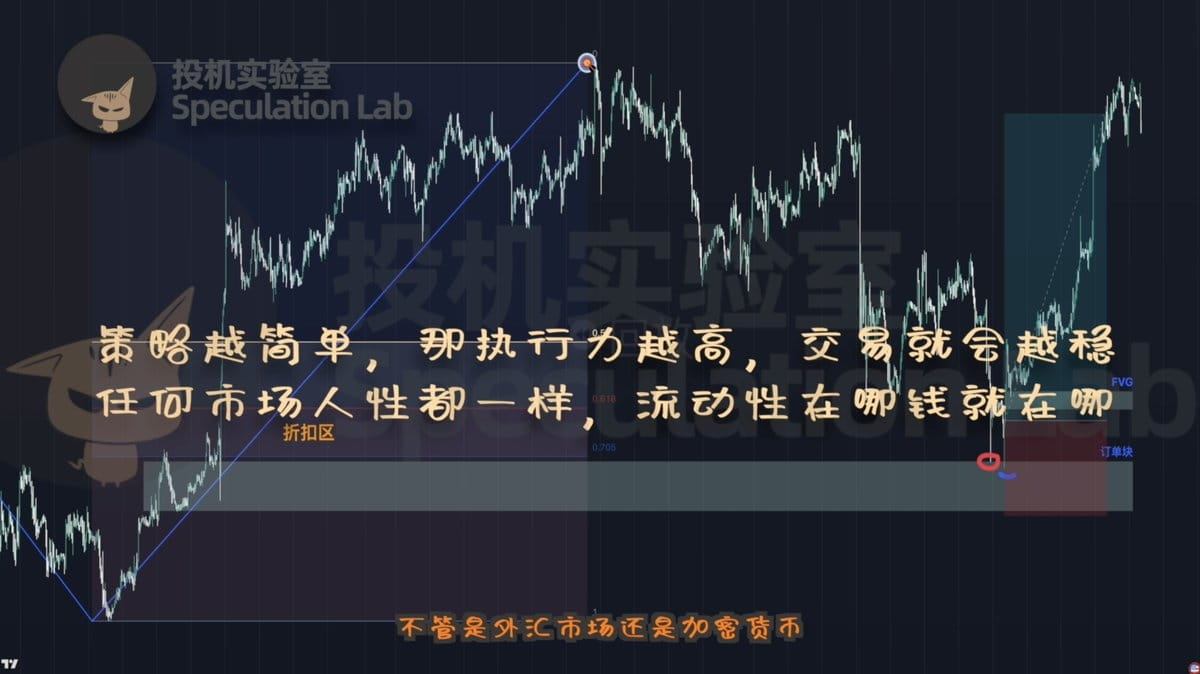
Switch to the 1-hour chart to find entry points. It can be seen that the price first breaks the short-term low, clearing liquidity and attracting shorts to enter, then quickly reverses and breaks upwards, forming a reversal signal. We can enter long when the price retraces to the structural level. The price then shows strong upward movement and forms a new FVG as momentum confirmation, with the price continuously reaching new highs.
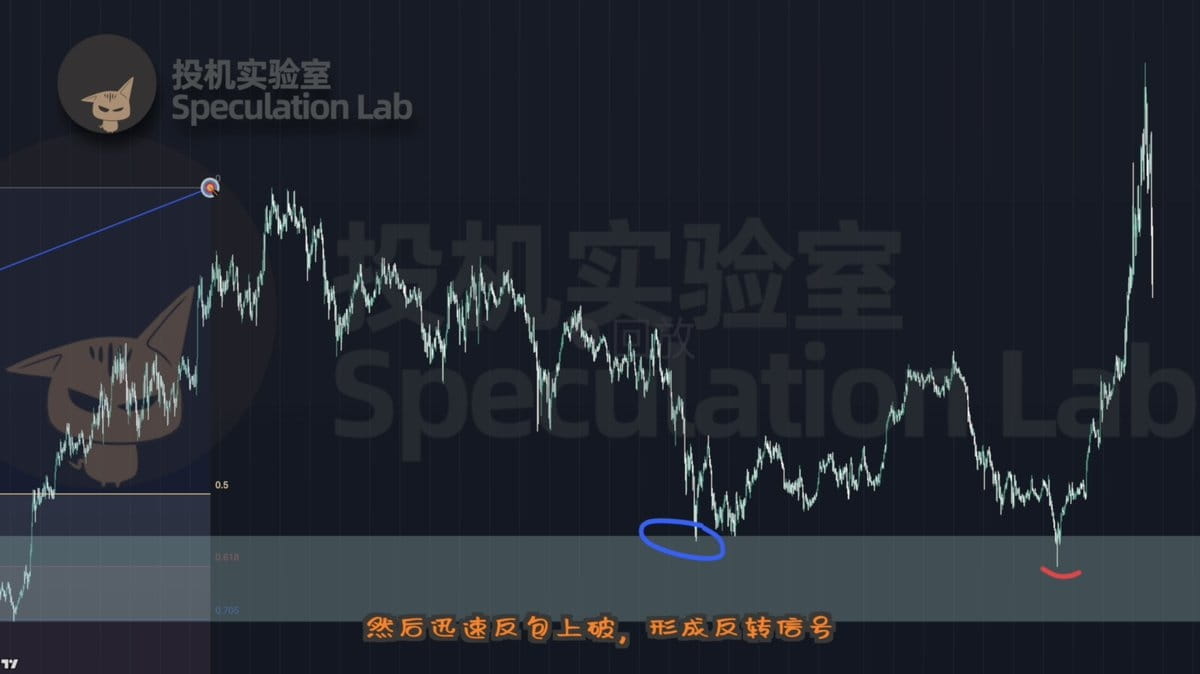
This model is not only applicable to the cryptocurrency market but is also effective in the forex market. For example, in GBP/USD, after confirming that the overall trend is upward on the daily chart, one can draw the high and low points of the wave, marking the discount zone and finding the bullish order block within it. Subsequently, the price clears short-term low liquidity within a smaller time frame, followed by large buy orders causing price reversal, disrupting the structure. At this point, we can confirm the short-term trend is strengthening, and we can enter long positions when the price retraces to the structural level. The subsequent price also continues to rise, forming an FVG confirmation along the way and reaching the profit target.
The strategy is not difficult, Mayne says. The simpler the strategy, the higher the execution power, and the steadier the trade becomes. Whether in the forex market or cryptocurrency, human nature is the same; liquidity is where the money is. First, induce the majority to enter, then harvest in the opposite direction; trading is a hunt.
Alright, entertainment programs provide no investment advice. Check if you have clicked the subscribe button to avoid missing out on more profitable trading strategies. Good morning, good afternoon, good night, goodbye.