
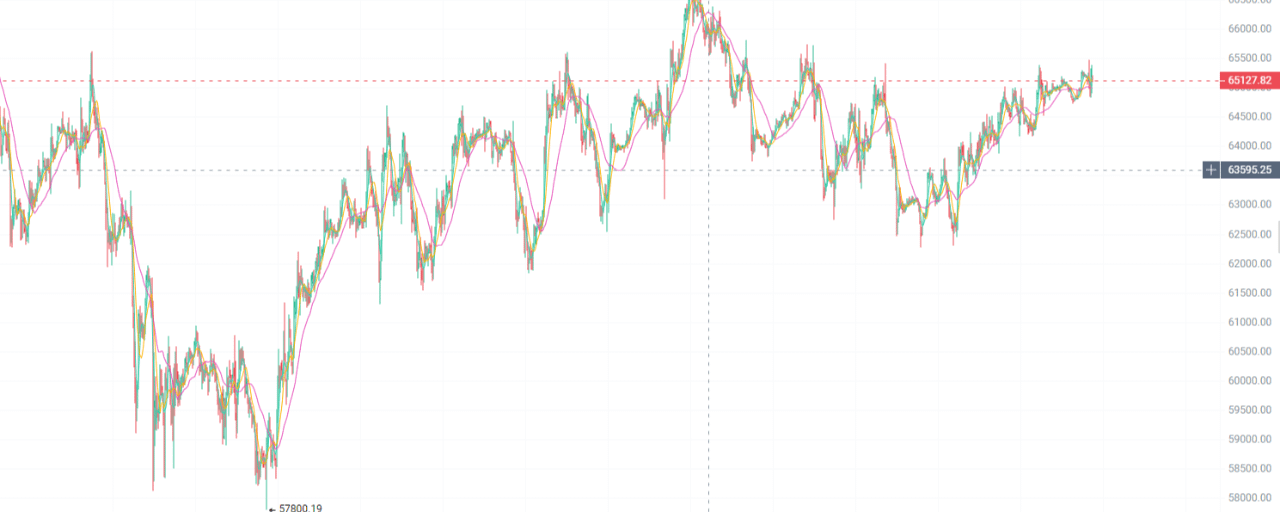

Based on the candlestick trend, BTC is currently trading around 65,100. In recent days, after rebounding from the lows, the market has continued to move upward in a choppy manner. However, after reaching the key resistance zone of 65,000–65,500, multiple attempts failed to produce a valid breakout. From the market structure, although the bulls still hold a certain advantage, short-term upside momentum has started to slow; the moving averages are gradually converging, and the market has entered a high-range tug-of-war. The key focus now is the resistance above 65,000 and the support around 64,000. In the short term, it is more likely that traders should wait for a pullback after a push higher.
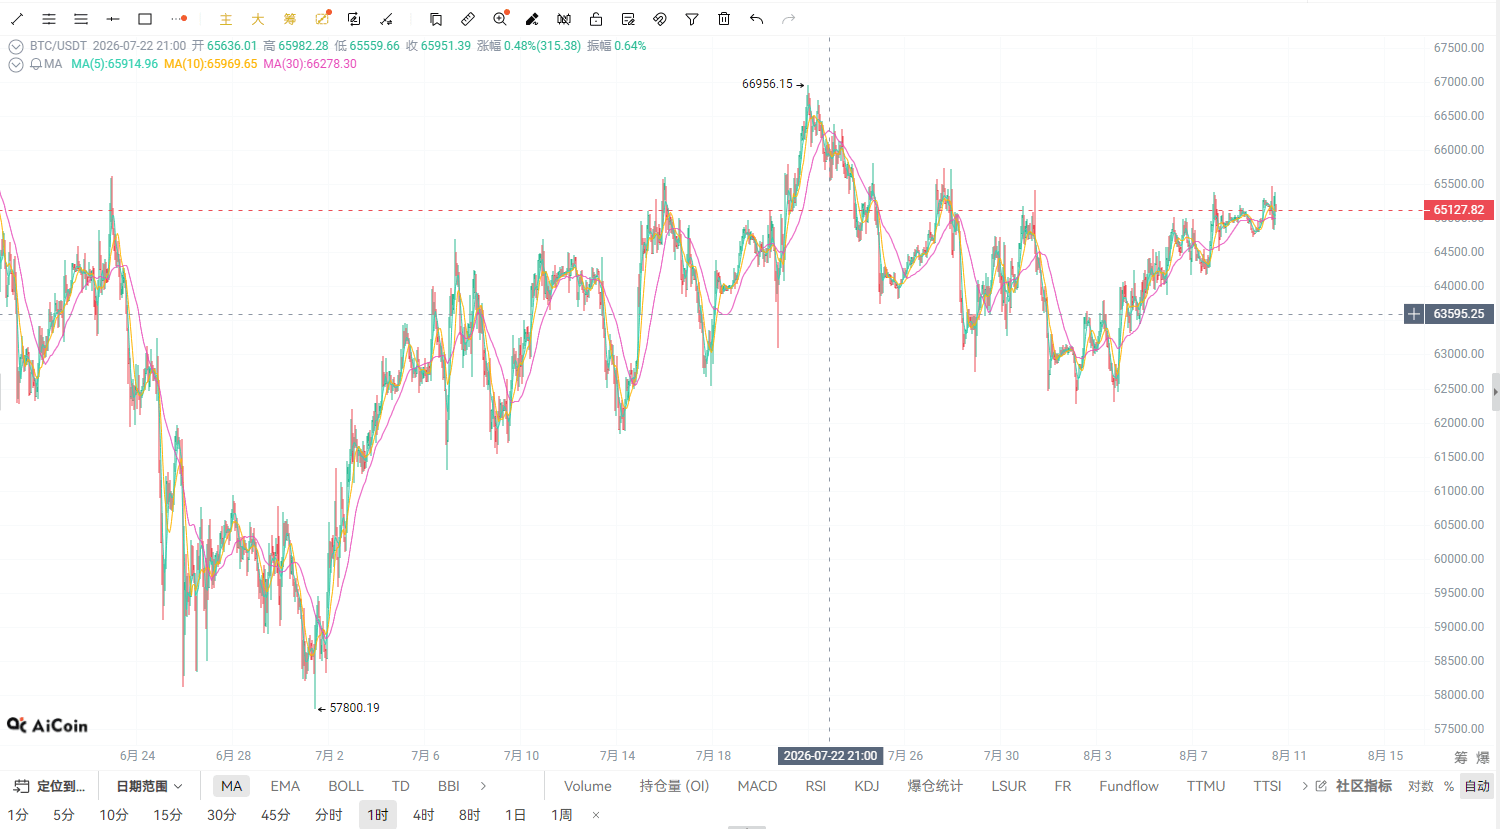
From the one-hour chart, BTC has recently been repeatedly oscillating around the 64,500–65,500 range. After multiple touches above 65,000, the price has pulled back each time, indicating that sell pressure above is gradually increasing. Currently, the hourly moving averages are beginning to flatten; short-term chasing capital is decreasing, and the candlesticks are forming a high-level consolidation pattern. If the price cannot subsequently break through the 65,500 resistance, the market is likely to see profit-taking in the short term, with a pullback toward the 64,500 and even the 64,000 area. On the hourly timeframe, conditions are currently more tilted toward range-bound and bearish—wait for resistance confirmation before positioning.
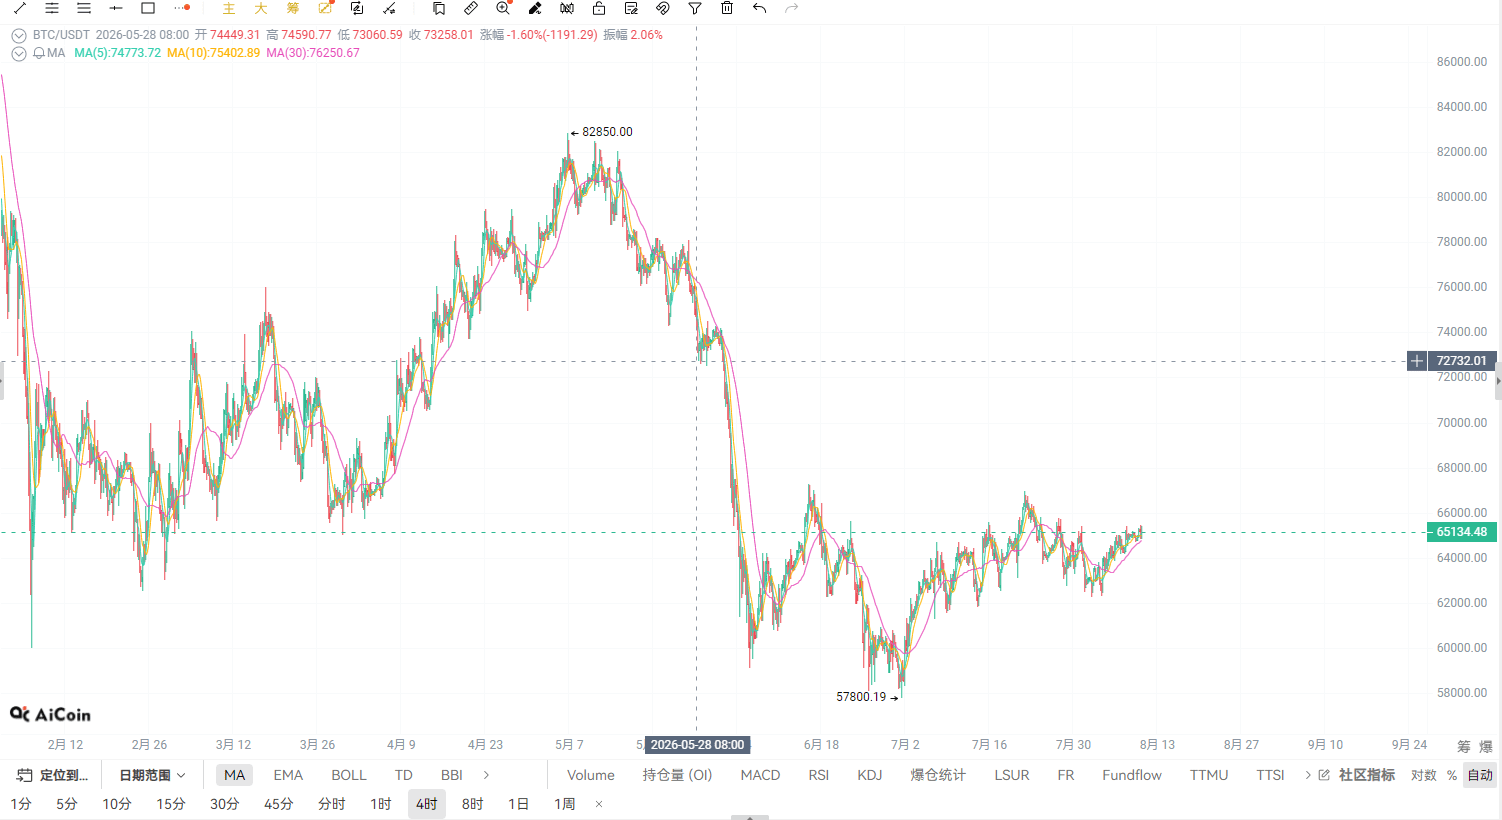
On the 4-hour chart, after the prior decline, BTC has quickly repaired and is now back above the 64,000 area. The overall rebound structure remains intact. But looking at the price action, the 65,000–66,000 zone has consistently shown clear resistance; multiple rallies have been accompanied by weakening trading momentum, suggesting that there is disagreement among funds at higher levels. Although the 4-hour moving averages haven’t fully turned bearish yet, the price is already close to the resistance band, and a technical pullback is likely in the short term. If 64,000 support is broken, the market may further test 63,500 and even the 63,000 area.
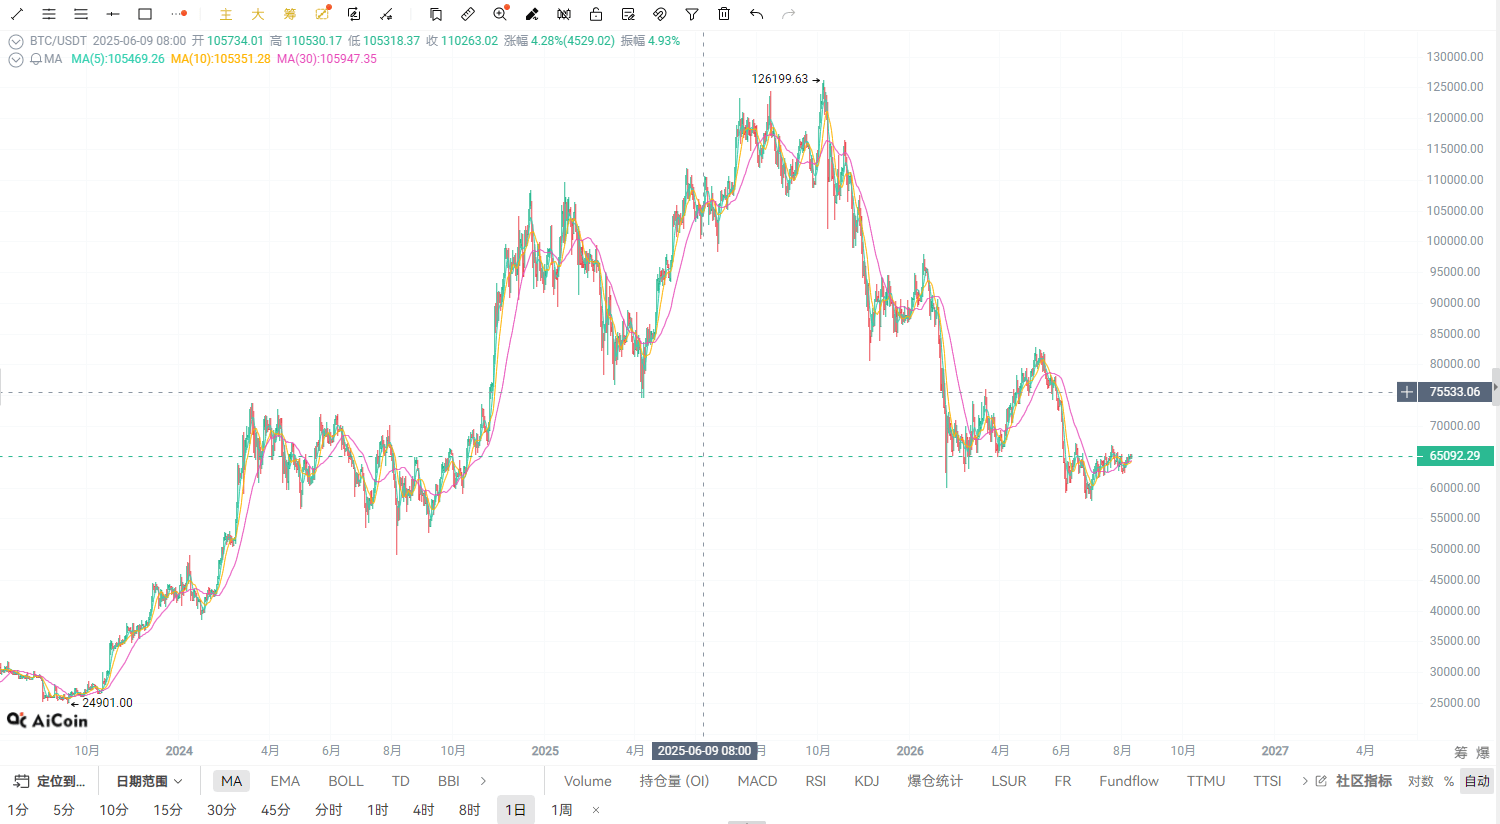
On the daily timeframe, BTC is currently in a crucial phase after a rebound. The previous swing lows have been gradually rising, and market sentiment has recovered somewhat. However, after a series of consecutive daily gains, the price has moved into a previously dense trading area, where resistance above 65,000 is evident. If it cannot break above 66,000 with increased volume, it’s easy for a move of “rally then pull back” to form. The daily trend has not fully turned bearish yet, but in the short term, it’s necessary to guard against consolidation and pullbacks at higher levels, and wait for the market to choose a new direction again.
Overall, BTC is currently in a crucial resistance area. Although the uptrend hasn’t completely ended, the strength of its short-term push upward has clearly weakened. 65,000–65,500 is the key area to watch today. If the price continues to rise but fails to break through, the shorts may take the opportunity to gain momentum. In terms of execution, it’s not advisable to chase blindly higher. Instead, prioritize pullback opportunities near resistance levels, keep position sizing under control, and wait for market confirmation.
Real-time order strategy:
Go short near BTC’s current price of 65,100
Direction: Neutral
Opening price: 65,100
Stop-loss price: 66,000
First take-profit: 64,450
Second take-profit: 63,800
(Market conditions change rapidly. The above strategy is formulated based on the current candlestick structure. During trading, strictly control position size and manage risk properly.)