Sister U 8.10$ETH Morning Strategy
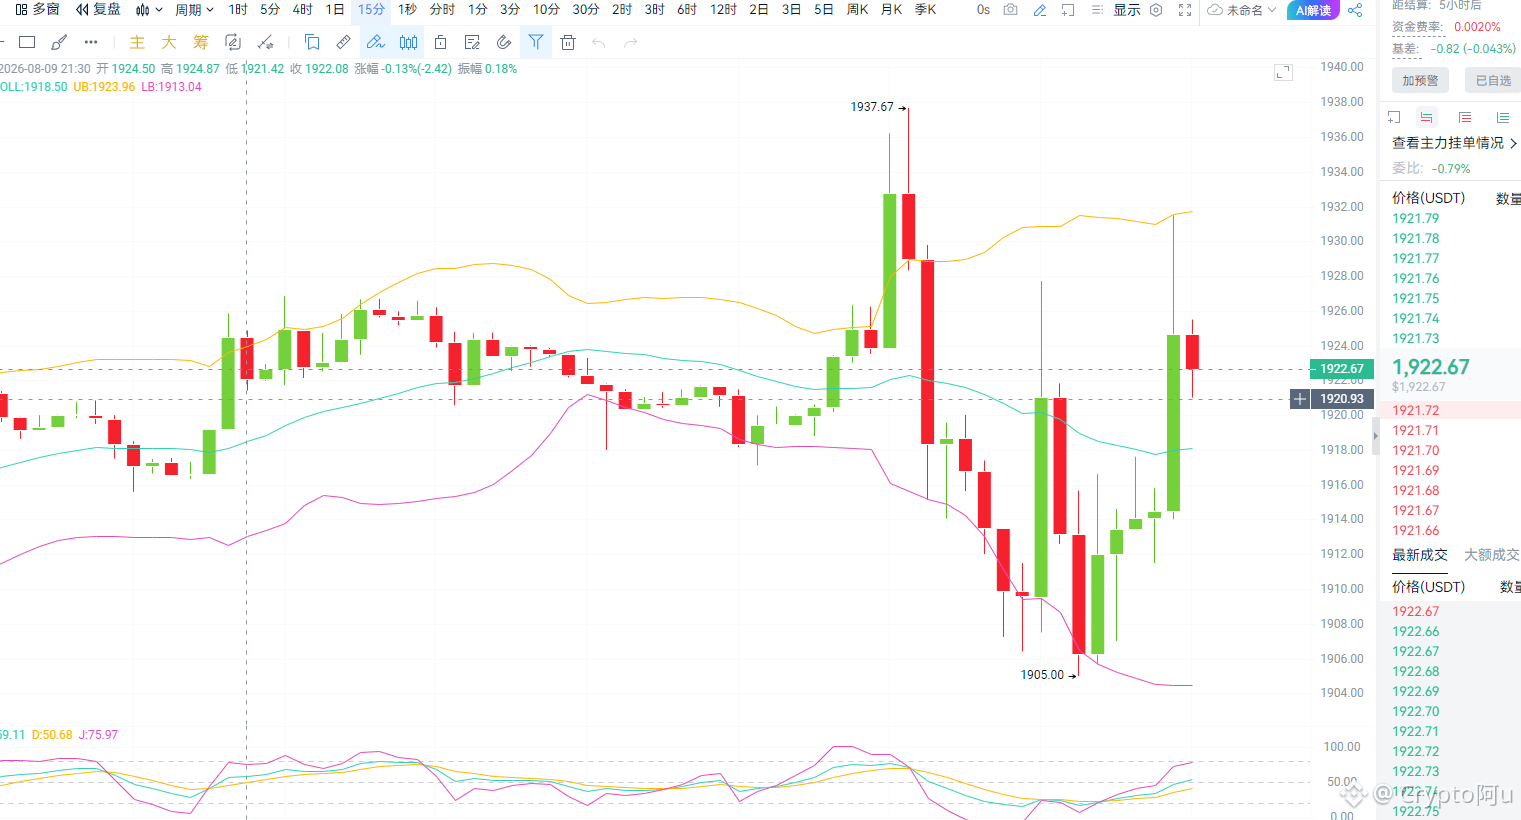
On August 10, the 4-hour Ethereum chart is clear. After earlier surging to the 1943 high on the back of favorable nonfarm payroll news, it quickly came under pressure and fell back. The rally failed to hold at the higher level, and the upward momentum of the bulls has visibly weakened. The upper Bollinger Band forms resistance; the candlestick closes as a pullback bearish candle. The KDJ indicator has turned downward from a high level, and a short-term pullback trend has already started. A large amount of profitable positions and trapped orders have accumulated in the 1925–1940 range above; selling pressure is heavier when price rebounds to this area.
For the short term, focus on going short on rallies. Enter short positions in the 1924–1935 range, with a stop-loss set at 1945 to prevent price from breaking above the high again and reversing the trend. The first downside target is 1900, and the second target is 1880.
On August 10, the 4-hour Ethereum chart is clear. After earlier surging to the 1943 high on the back of favorable nonfarm payroll news, it quickly came under pressure and fell back. The rally failed to hold at the higher level, and the upward momentum of the bulls has visibly weakened. The upper Bollinger Band forms resistance; the candlestick closes as a pullback bearish candle. The KDJ indicator has turned downward from a high level, and a short-term pullback trend has already started. A large amount of profitable positions and trapped orders have accumulated in the 1925–1940 range above; selling pressure is heavier when price rebounds to this area.
For the short term, focus on going short on rallies. Enter short positions in the 1924–1935 range, with a stop-loss set at 1945 to prevent price from breaking above the high again and reversing the trend. The first downside target is 1900, and the second target is 1880.