
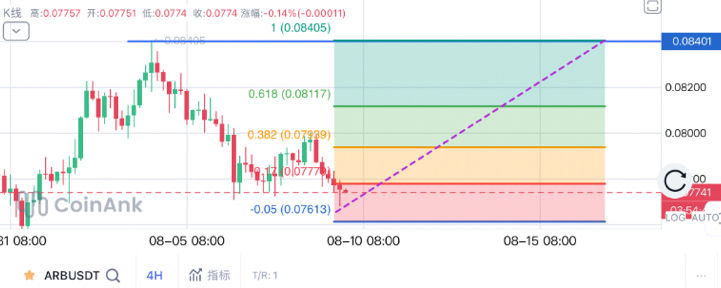
According to ChainCatcher, Web3 asset data platform RootData shows that Arbitrum (ARB) will unlock approximately 123.53 million tokens at 9:00 AM (UTC+8) on August 16, 2026 (about US$9.65 million, estimated based on the current price). This event has drawn attention in the market: many traders believe that before an unlock there is often “front-running” or emotional/positioning games, which could trigger an upswing. Combined with the current technical setup and a Fibonacci retracement structure, the long thesis has some support.
Unlock background and market psychology
ARB’s current price is moving within the US$0.077–0.081 range, with a market cap of about US$510–530 million and circulating supply of around 6.6 billion tokens (total supply: 10 billion). The unlock amount is relatively manageable (representing only a small portion of the circulating supply, with a value in the tens of millions of dollars), rather than a large-scale cliff-like release. Historical experience suggests that many projects see “expectation trading” before token unlocks: sell pressure from shorts is absorbed early, while longs take the opportunity to position, causing the price to first rise and then retrace, or break out directly on the momentum.
The overall crypto market is currently consolidating at relatively low levels. With BTC around $64,000, sentiment is cautious. As a leading L2, ARB’s ecosystem continues to make progress (including technical upgrades, adoption related to payments and RWA, etc.), so the fundamentals are not completely blank. The unlock itself doesn’t necessarily mean selling pressure will immediately hit hard—especially when the market has priced it in early, it may instead become a catalyst for “bad news already out.”
Fibonacci retracement perspective: The current position offers room for a rebound
From a technical analysis perspective, ARB has recently formed a consolidation structure near the lows. Based on multiple chart analyses (daily and weekly), the price previously fell back from a higher range (e.g., around 0.14–0.15) to a low near 0.07, and then repeatedly tested the 0.075–0.082 area.
Typical Fibonacci retracement levels (measured from the recent significant high to the low) are roughly as follows:
0.236 retracement level: around 0.130 (farther resistance)
0.382 retracement level: around 0.119
0.5 mid-level: around 0.110
0.618 Fibonacci level: around 0.100–0.101
0.786 retracement level: around 0.087
The current price (about 0.078) has fallen below or is approaching a deeper retracement area and is nearing a support zone. Multiple analyses indicate that the price is consolidating near the edge of an ascending channel or a wedge structure. If it holds the 0.075–0.077 support area and breaks through the 0.080–0.082 resistance zone with increased volume, it could move toward 0.09–0.10 (corresponding to around the 0.618 level) and potentially higher targets. Weekly charts also mention the possibility of higher targets (around the 0.15 range), but more realistic in the short term is first testing 0.09–0.10.
The core meaning of Fibonacci retracements is that after the price retraces sharply from a high point, it often finds buying support at the Fibonacci levels—or deeper retracement areas. Currently ARB has already retraced sufficiently. Combined with the pre-unlock expectation game, it’s easier to form a “technical oversold + event catalyst” confluence.
Long (buy) logic and trading approach
Event-driven: Once the first ~week (around) is unlocked, the market often shows a “buy the expectation” style trend. If trading volume increases and long-side capital moves in, the price may first surge.
Technical confluence: Hold key support (around 0.075). A break above 0.080–0.082 can confirm short-term bullish momentum. Targets can参考 the Fibonacci 0.786–0.618 zone (about 0.087–0.10).
Risk control: The unlocking itself may still bring short-term selling pressure. The stop-loss suggestion is to place it below a clearly broken level (e.g., 0.073–0.075), control position sizing, and avoid going all-in.
Time window: From now until around August 16 (around the unlock period) is the key observation window. If it breaks through early and holds, you may be able to continue holding; if it falls first then rises, you can wait for a pullback to buy the dip.
Overall, based on technicals, ARB’s current position already shows signs of a sufficient retracement. The unlock event provides sentiment and liquidity catalysts. Going long is not mindless chasing; it’s a conditional trade based on “support holding + breakout confirmation + event window.” The market always has uncertainty—this is only an analysis perspective combining technicals and events and does not constitute investment advice. For actual trading, please consider real-time order flow, position management, and your own risk tolerance.
$ARB If ARB can use this window to move out with a wave and advance toward the Fibonacci key resistance, it would be an effective validation of the current consolidation at low levels. Watch volume and confirmation of the breakout—this may help capture the potential upswing.
#ARB
$ARB
