
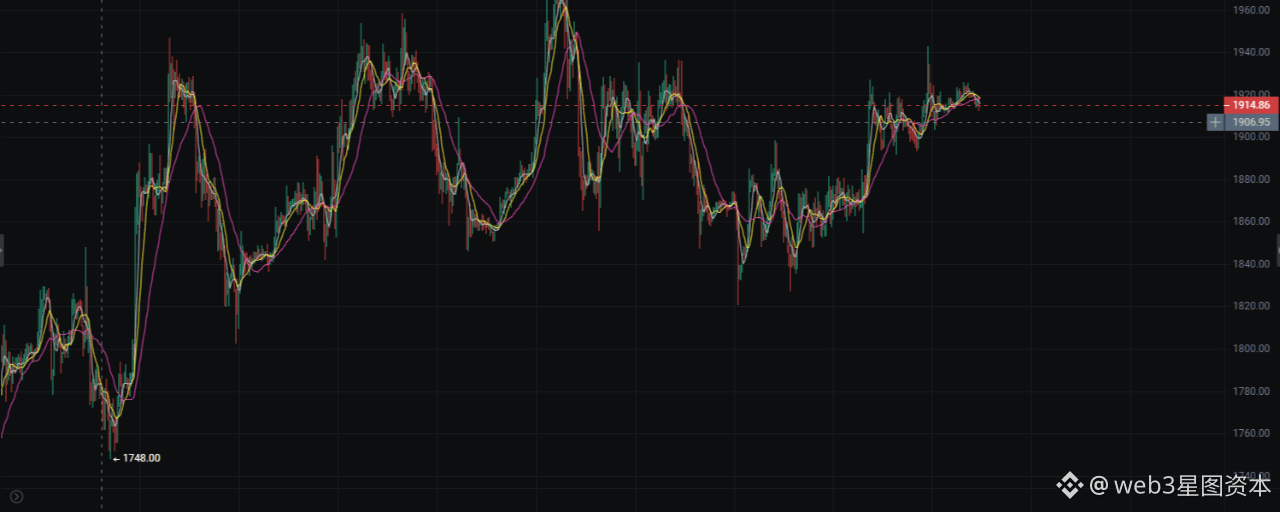

Based on ETH’s current candlestick trend, the price is moving around 1915.94. After the recent rebound from the low near 1748, the market has gradually formed a pattern of oscillation and upward movement. The current price has regained the 1900 level, and bullish sentiment in the market is starting to recover. However, there is still noticeable resistance in the 1920–1950 area above. Overall, ETH in the short term is in a consolidation phase after an up move. Funds are waiting for a direction to be chosen, and intraday attention should focus on buy-the-dip opportunities after a pullback.
Daily timeframe analysis: the rebound from the bottom continues, and the bullish structure is gradually being restored
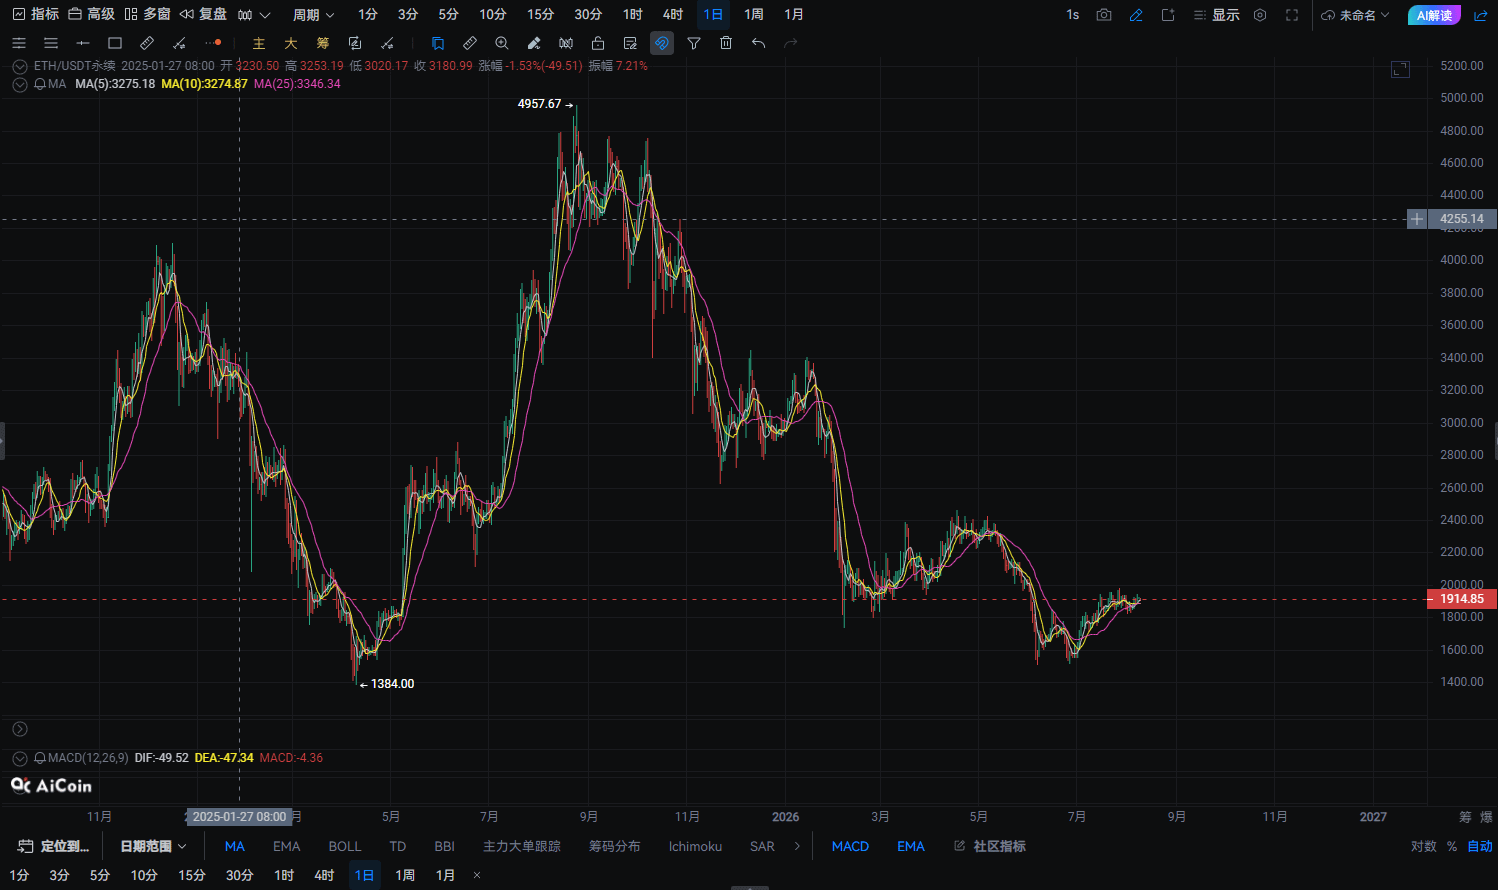
From the daily chart, ETH previously formed a stage of support around 1748. Then it rebounded quickly, and the price climbed back up all the way above 1900. Currently, the candlestick has returned to the vicinity of short-term moving averages. MA5 and MA10 are gradually turning upward, indicating that short-term buying interest is strengthening.
Regarding the MACD indicator: after the earlier bearish momentum continued to dissipate, the green histogram has noticeably shortened. The two lines are gradually drawing closer, and selling pressure has weakened. While further confirmation is still needed for a full bullish turn, the daily structure has already shown clear signs of repair.
For today’s daily chart, focus on support at the 1900 whole-number level. If price can stabilize above 1900, there is a chance to test the 1950 and 2000 areas again. If 1900 breaks down, price may pull back again toward around 1860 to find support.
Daily key levels:
Overhead resistance: 1950, 2000, 2050
Support below: 1900, 1860, 1820
Four-hour analysis: range-bound with an upward lift; pullbacks are opportunities
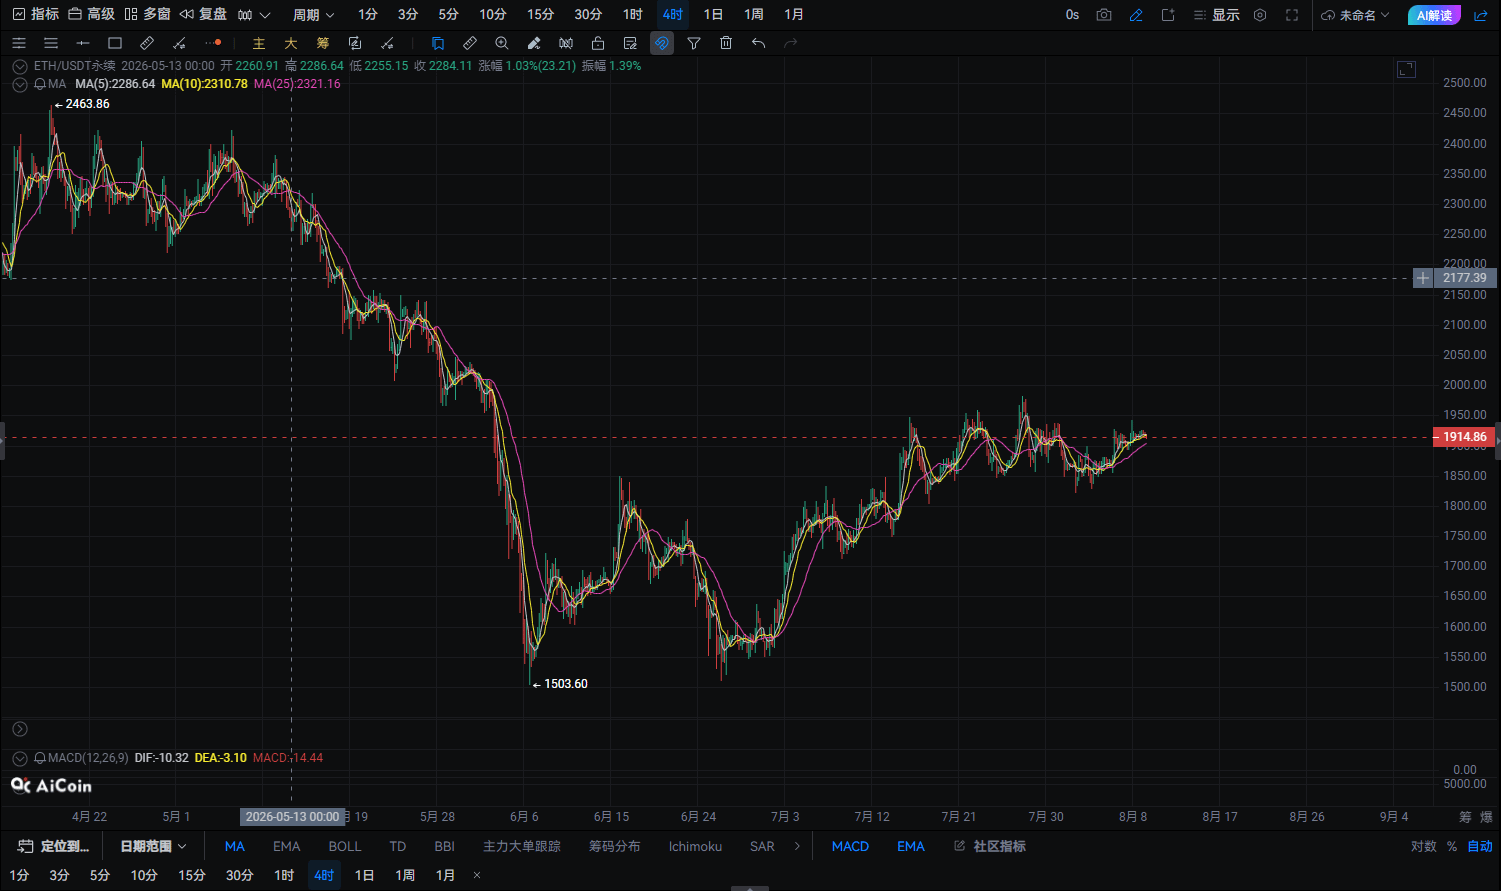
From the 4-hour candlesticks, ETH has recently formed a clear higher-low structure, rebounding gradually from around 1800 to the 1915 area. The current price is trading in a range around 1900-1920, indicating that bulls and bears are exchanging positions and liquidity.
As for the moving averages: the short-period moving averages have been trending upward. After several pullbacks to around 1900, price quickly recovers, indicating strong support from buyers below. As for MACD: bearish momentum is gradually decreasing, the indicator is entering a repair state, and the market appears to have further upside demand.
However, the 1920-1950 zone is a high-volume trading area from the earlier period. If there is no breakout with increased volume, the short term may see consolidation and shakeouts. Therefore, it’s not recommended to chase higher prices; it’s better to wait for a pullback to set up around support.
Four-hour key levels:
Resistance levels: 1920-1950
Support levels: 1900-1880
One-hour analysis: building momentum in the short term; waiting for a breakout signal
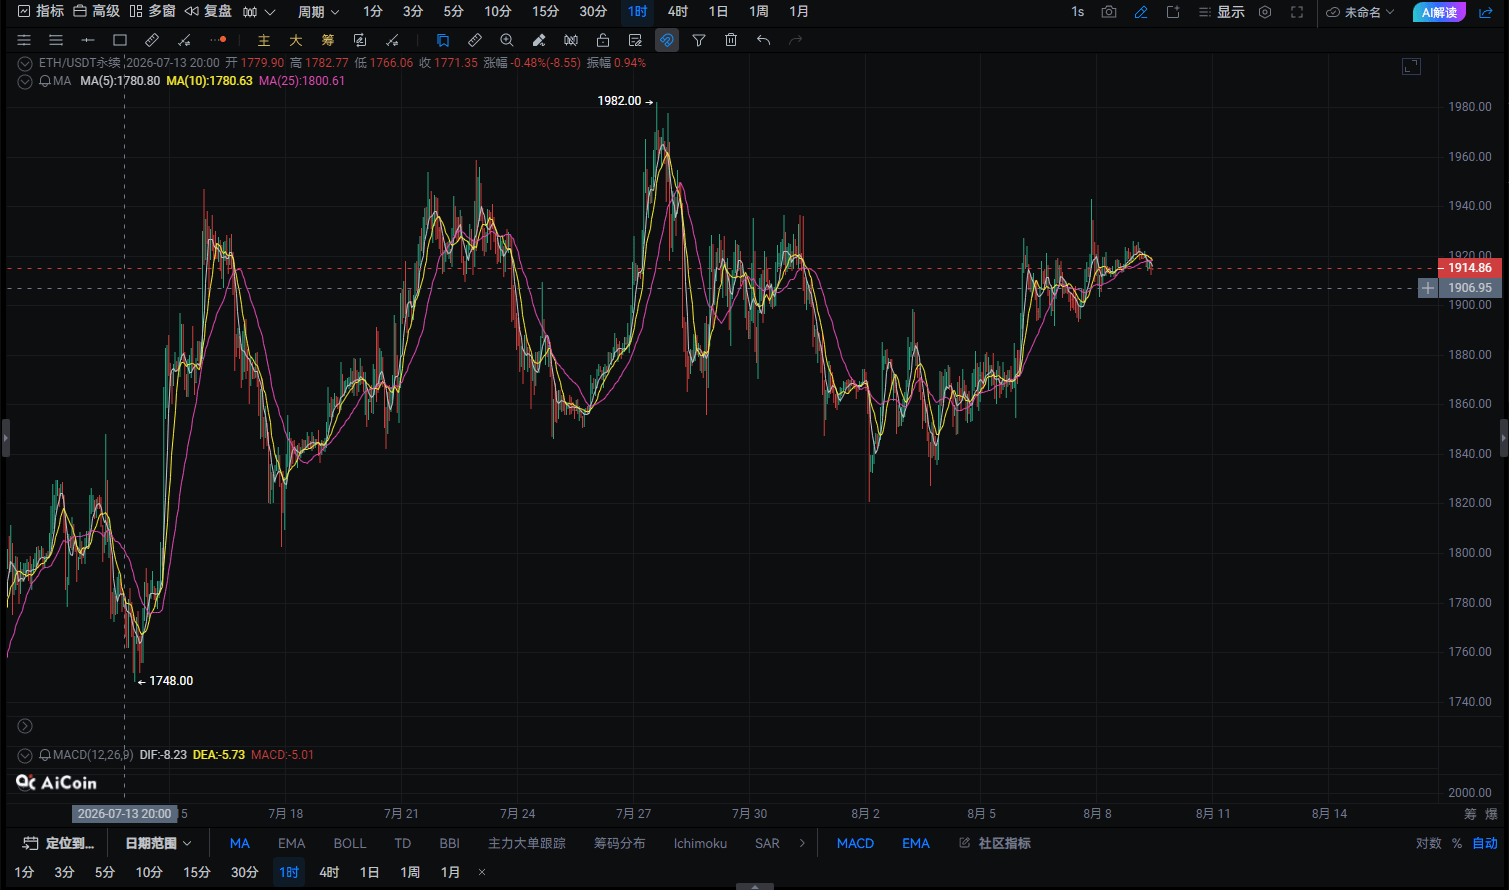
On the hourly timeframe, ETH is currently consolidating sideways around 1915. Price fluctuations have narrowed noticeably, and the moving averages are starting to stick together, suggesting the market is in a pre-breakout phase.
From the details of the price action, there have been multiple tests around 1900 without a significant selloff, indicating that short-term buy-side demand is still present. If price later breaks above the 1920 resistance, it may easily draw in short-term funds and push toward the 1950 and even 1980 zones.
On the hourly timeframe, the MACD is currently in a sideways repair state. Bearish momentum has clearly weakened, and in the short term the outlook is more biased toward range-bound and slightly bullish.
One-hour key levels:
Resistance levels: 1920, 1950
Support levels: 1900, 1885
Today’s ETH trading suggestion:
Based on the overall daily, four-hour, and one-hour trends, ETH is currently in a consolidation phase after a rebound from the bottom. The broader trend is leaning bullish. With 1900 as an important support level, as long as price stays above it, the bulls still have room to keep pushing.
Real-time single-strategy:
Direction: Long
Entry price: Enter directly around 1915.94
Stop loss: 1877
First take-profit: 1935
Second take-profit: 1954
Trading logic: After the earlier correction, ETH completed a stop-and-rebound around 1748. The price has since reclaimed and held above the 1900 level. The moving-average structure is gradually strengthening, and MACD bearish momentum continues to fade. As long as the short term holds the 1900 area, the bulls may continue to challenge the 1950 and even 2000 zones.
The market always rewards the prepared. Real opportunities are not about chasing or killing the move; it’s about waiting for trend confirmation at key levels. ETH is currently accumulating momentum above 1900. Watch whether support is effective, follow the trend, and seize your own trading rhythm.