

BTC 88,000 held strong! The big bullish candle has been pulled up! Is it time to go all in and buy the dip?
Staring at the few shrinking green bars on the screen, I lit a cigarette and coldly replied, "Brother, the lifeline you see is, in the eyes of the big players, the rope hanging you from the tree."
Many people lose money because they can't distinguish between 'Rebound' and 'Reversal'. Today, let's not talk about the abstract; let's directly lay out that BTC 15-minute level SMC (Smart Money) and use the most brutal institutional logic to tell you: why the current rise is a well-planned 'dead cat bounce'.
1. Don't be fooled by the green columns, look up at the knife above your head.
Do you think that hitting 88,230 means it's the bottom? Too naive.
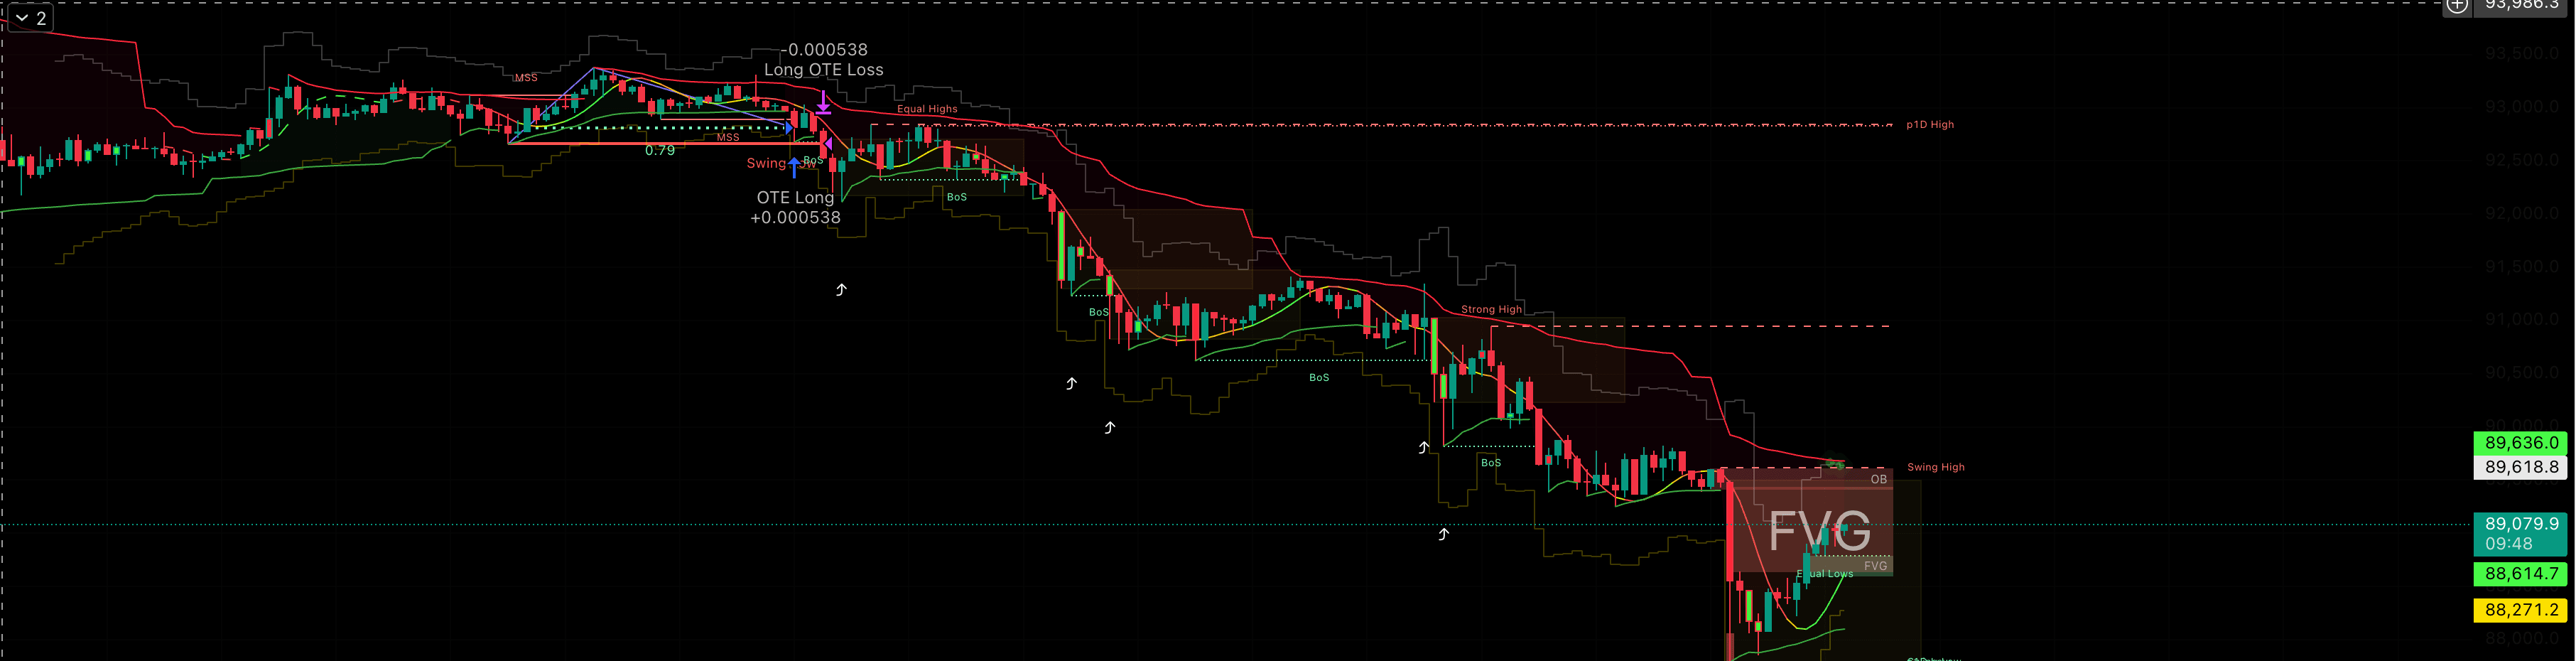
In the SMC trading system, there is only one standard for judging trend reversals: structural damage (BoS).
Please see the chart:
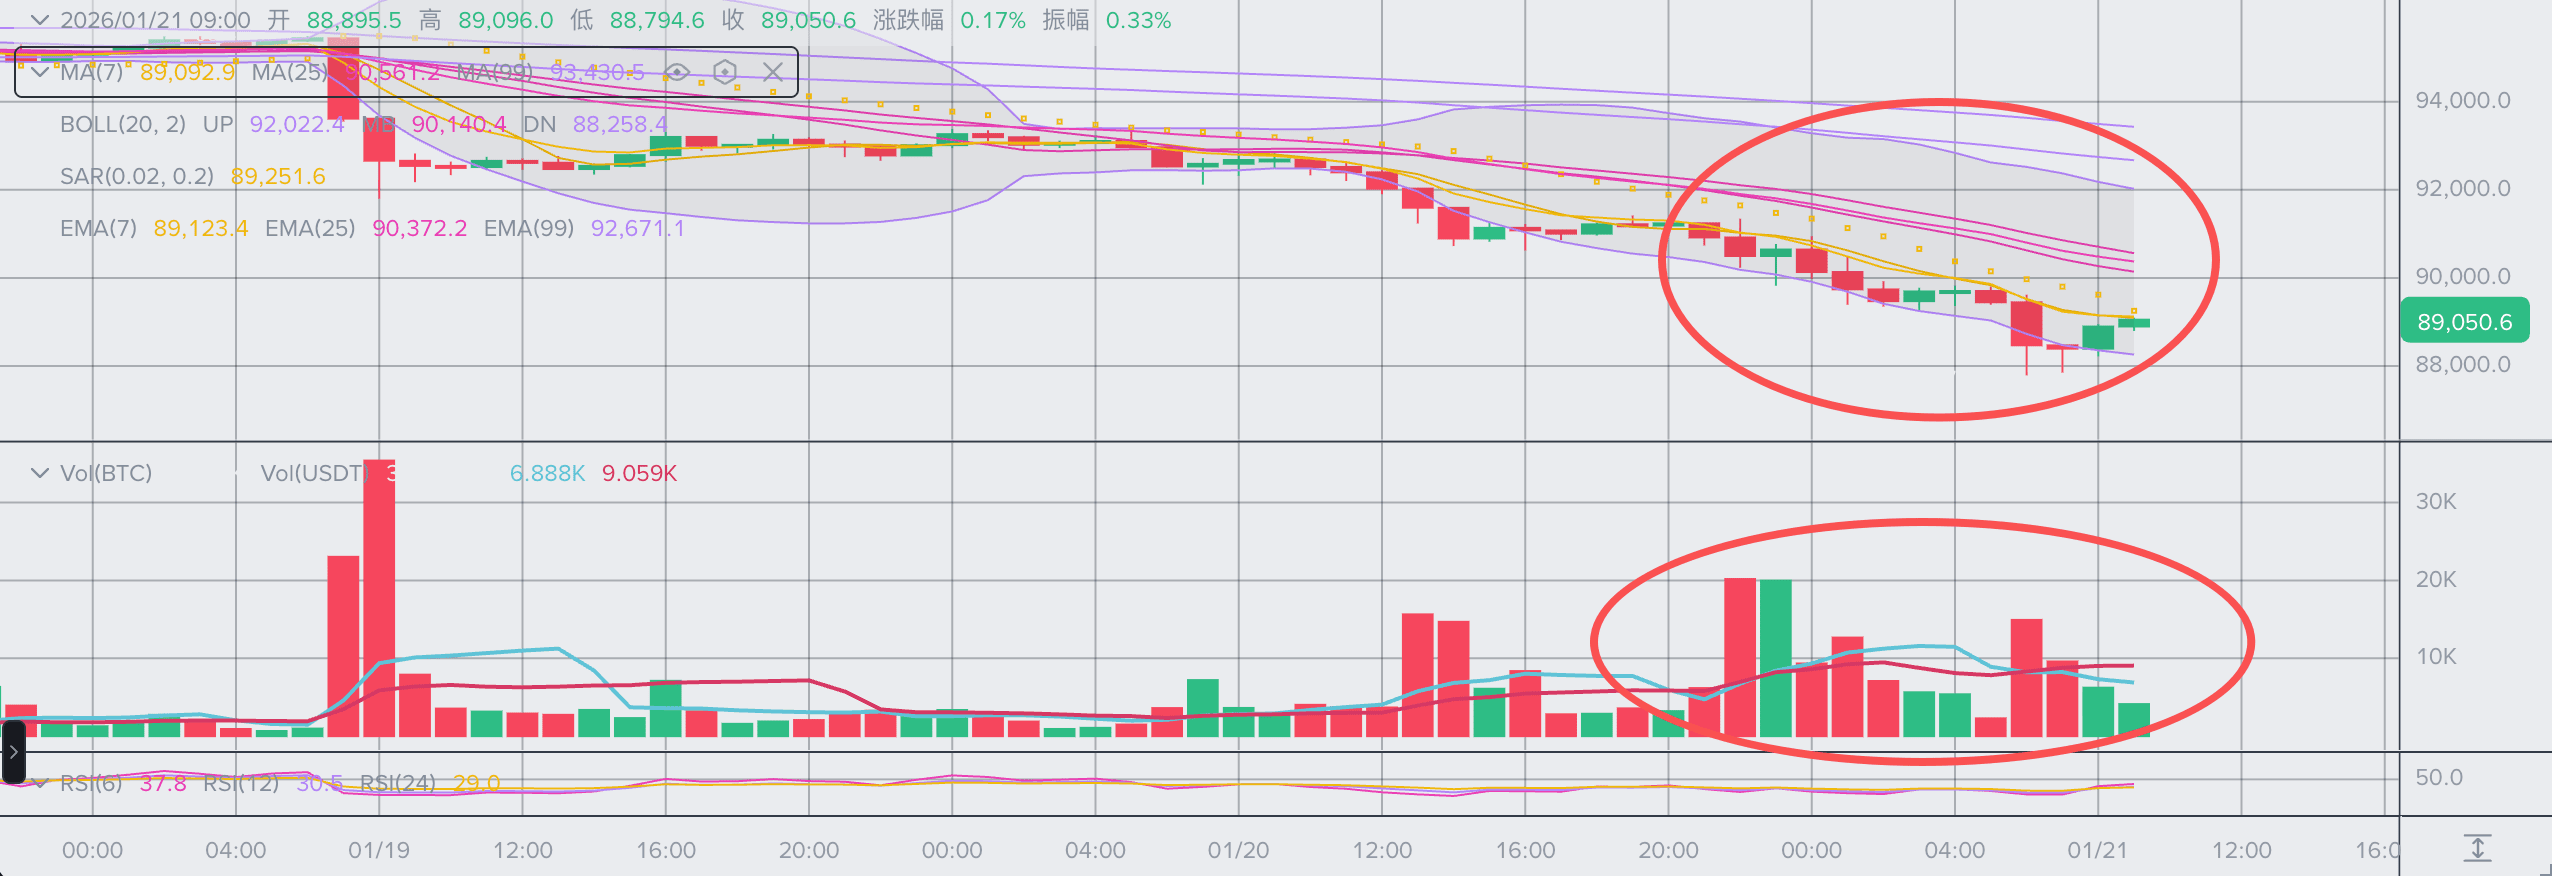
Although the price has indeed rebounded a little, in the micro structure, the highs are still continuously lowering (Lower Highs).
The life and death line of bulls: clearly marked on the chart, the Swing High is at 89,644.5.
The harsh reality: as long as the price does not break through and stabilize above 89,644 with volume, every dollar increase now is essentially a 'continuation of the decline'. Just like a ball thrown from upstairs, no matter how high it bounces, it cannot change the physical law that it must land.
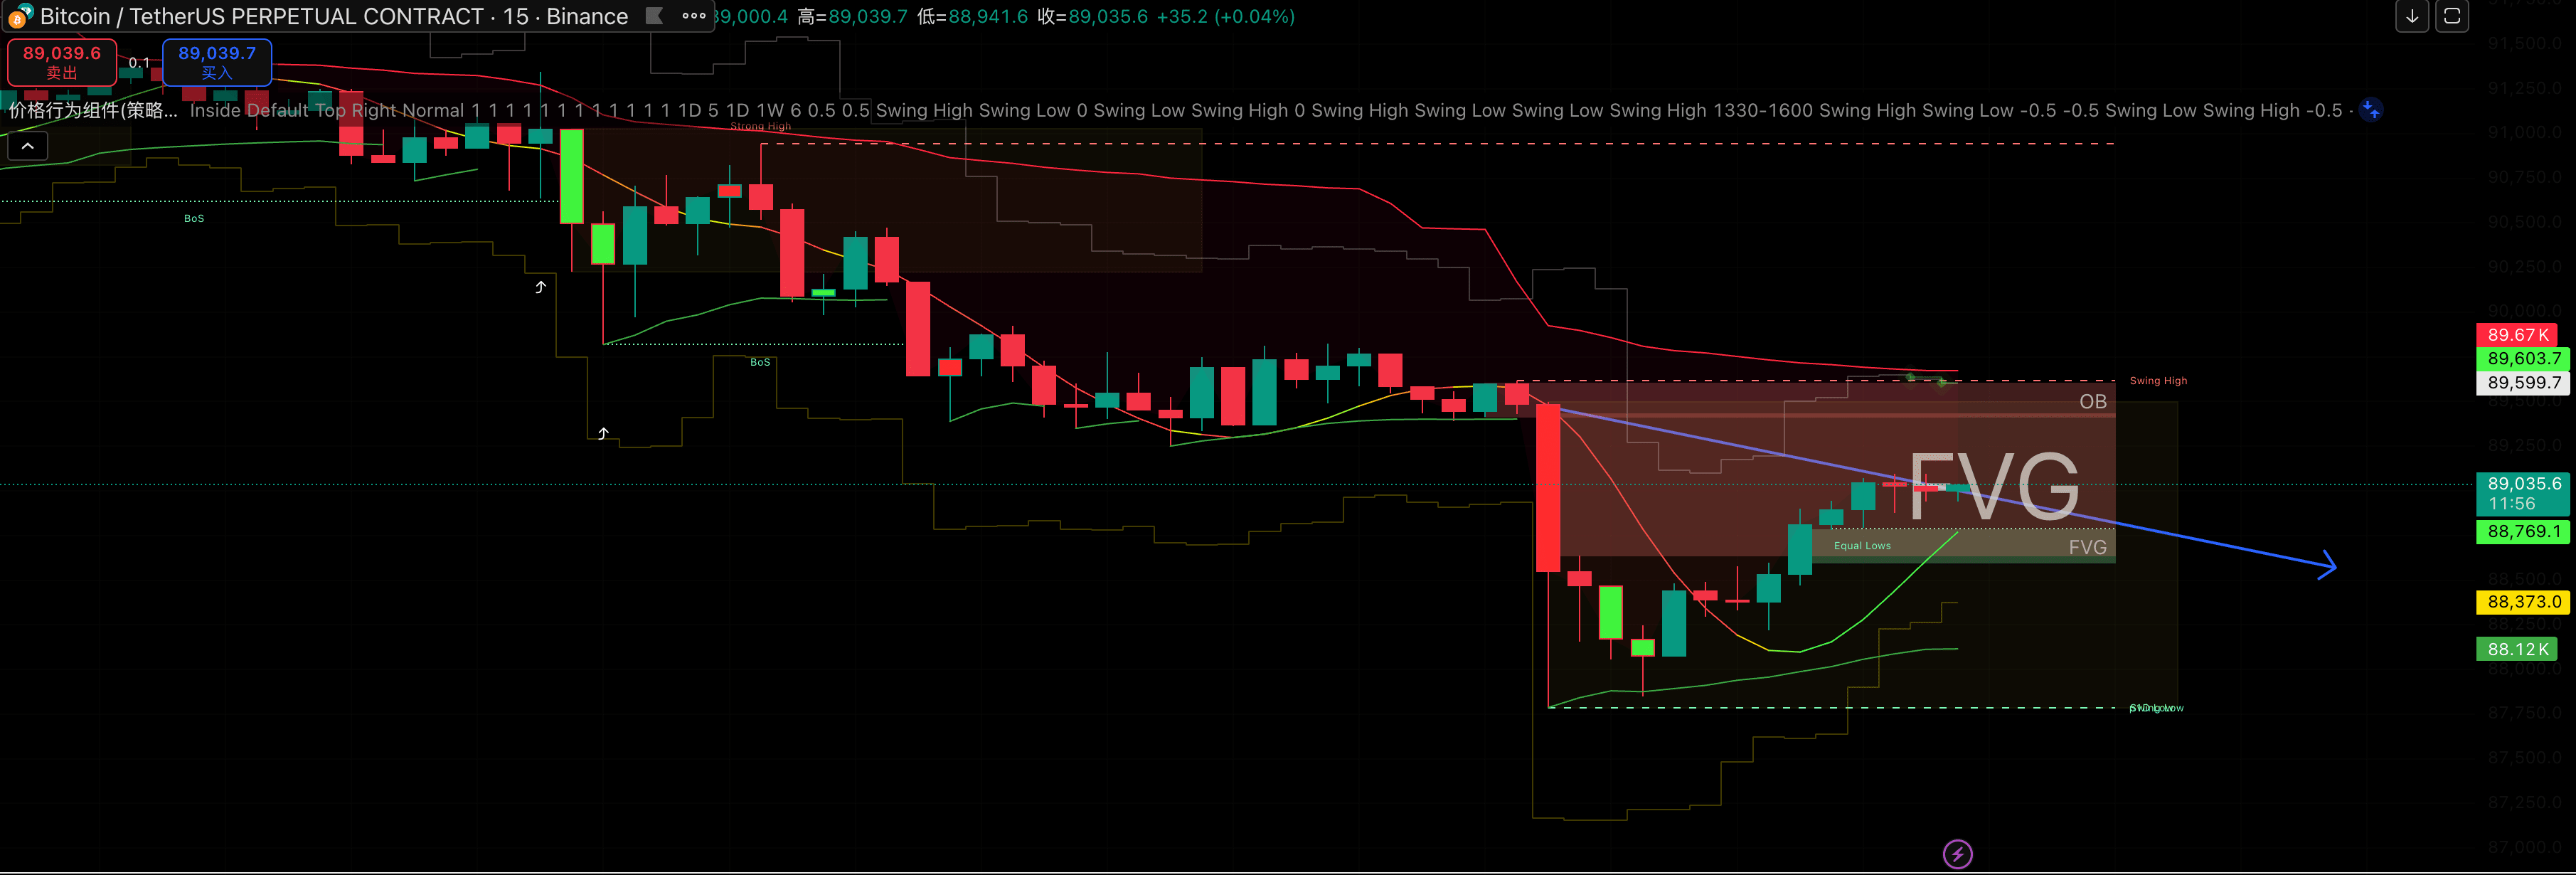
2. FVG trap: the operator is 'filling the pit.'
Why is there a rebound? Is it because the bulls are strong?
Wrong. It is because the bears are tired of smashing and need to refill the gap (Refilling FVG).
The huge red rectangular area in the chart (FVG) is roughly between 88,900 - 89,500.
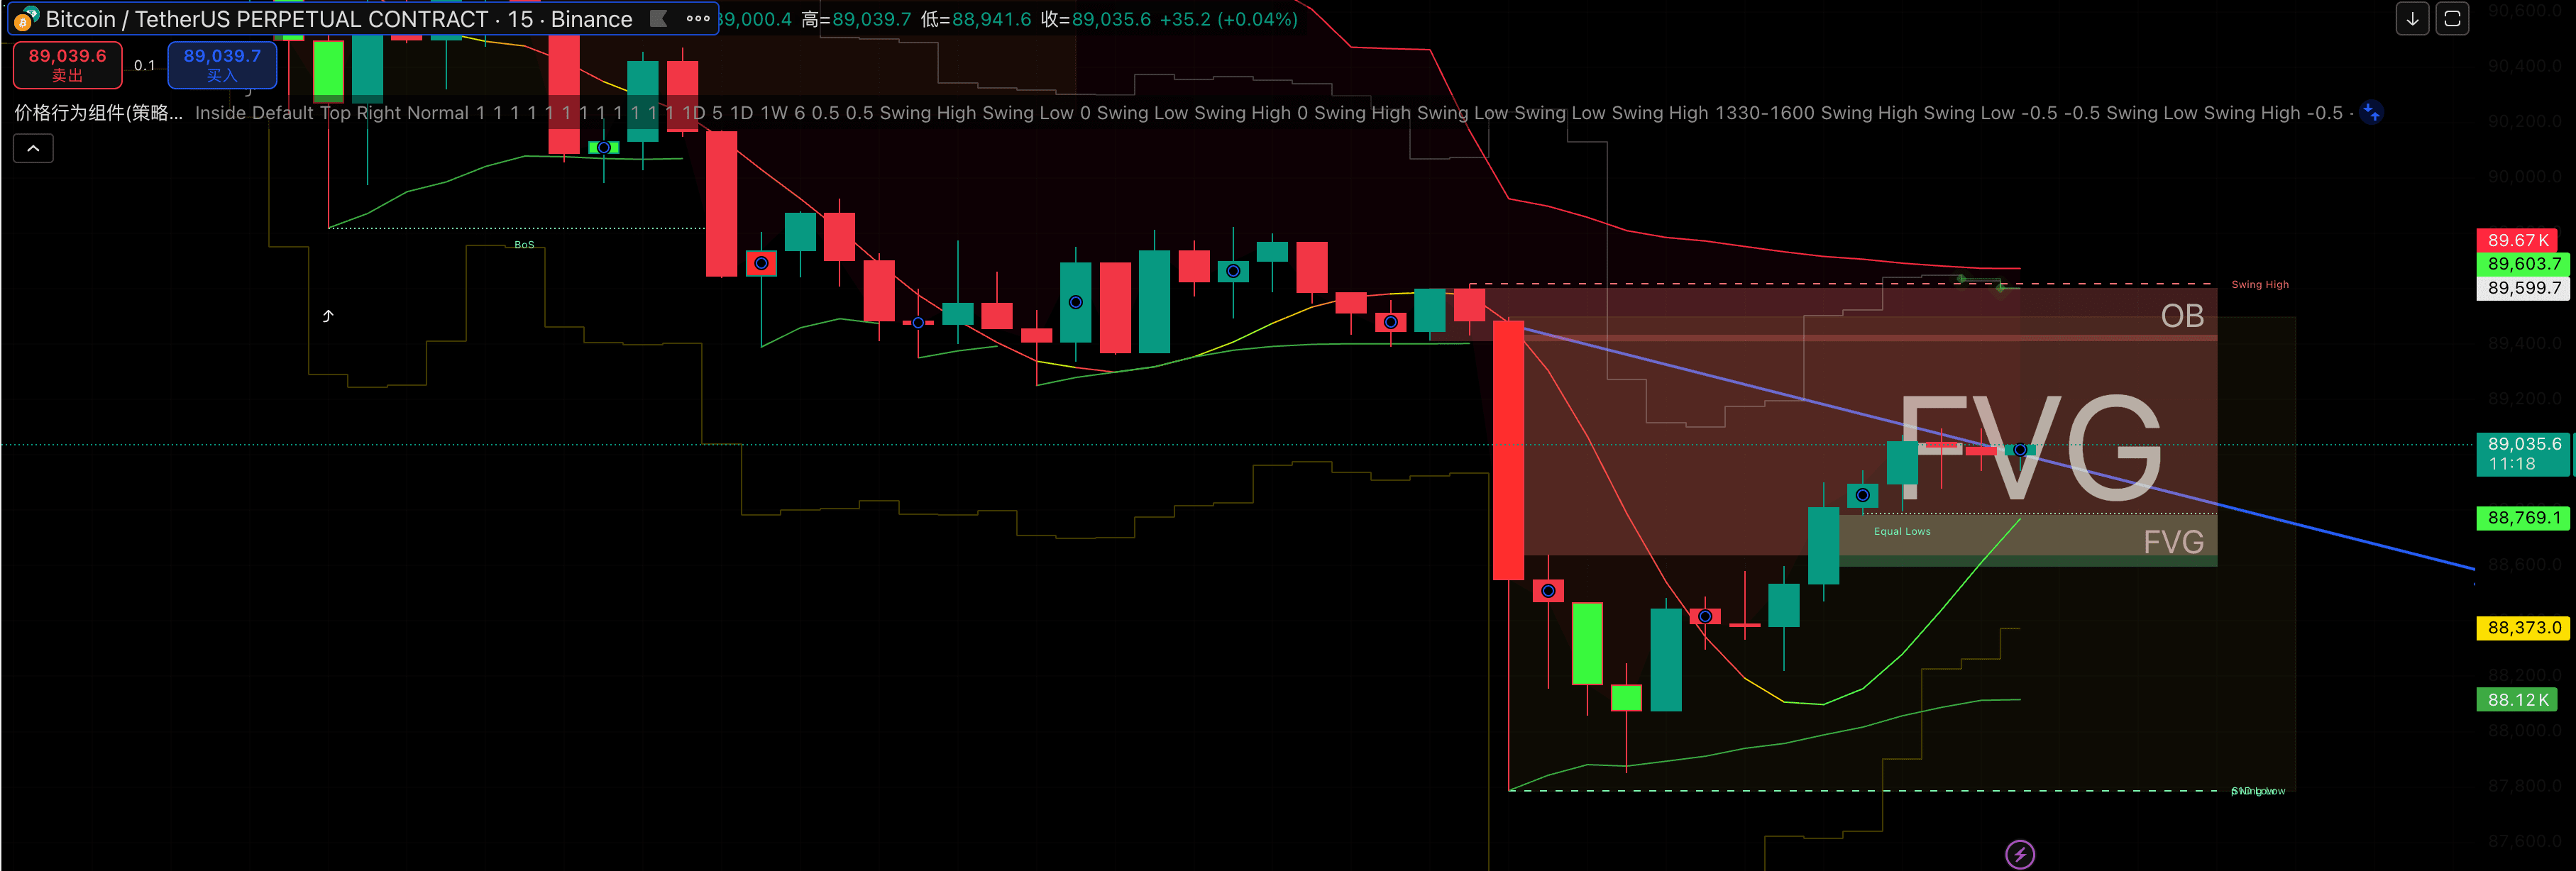
What is this? This is the 'vacuum zone' left during the last rapid drop.
What is the operator doing? The price pulling back here is not to allow you to break even, but to allow the short institutions that didn't get in earlier to short at a better price.
Scenario analysis: once the price appears with a 'long upper shadow' or 'weakness in rising' in this red area, that is the signal of the trap closing.
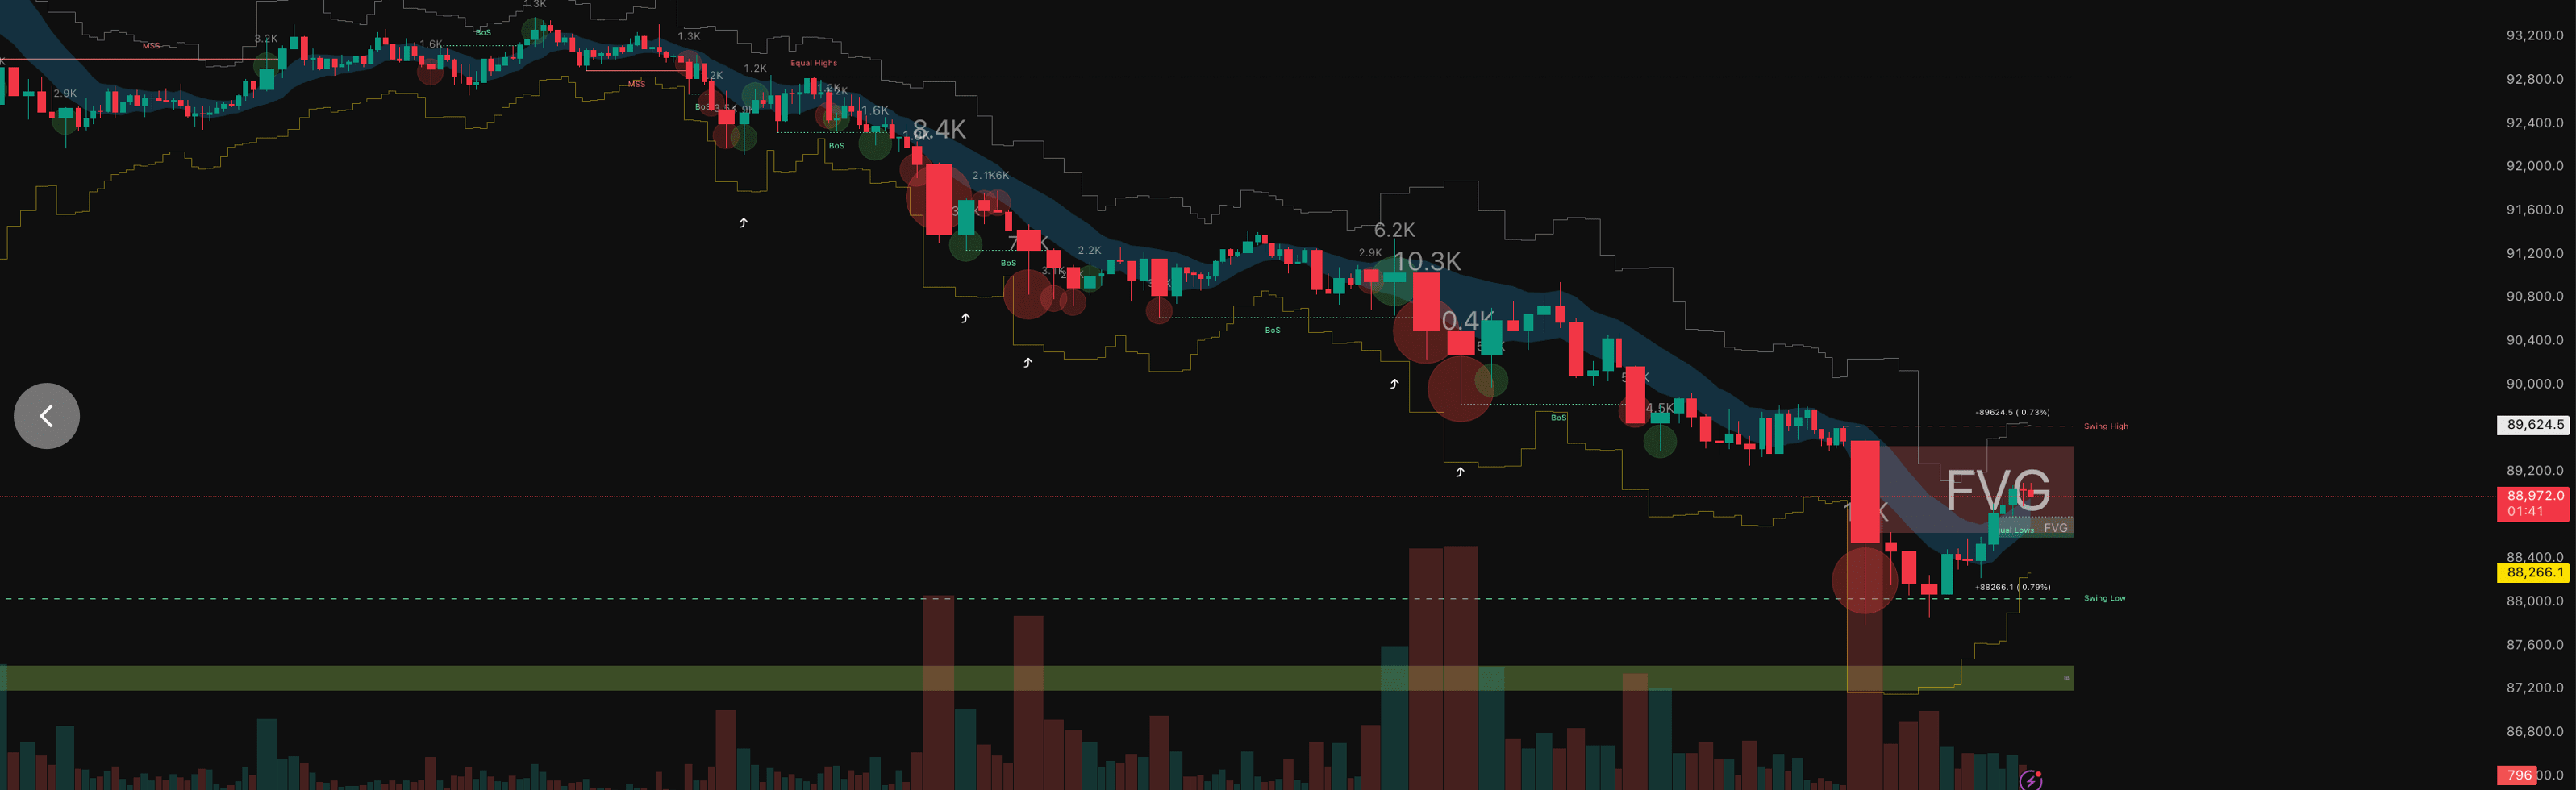
3. Volume does not lie: a decrease in volume with an increase = baiting.
What makes me most vigilant is the trading volume.
During a decline: look at that red volume bar at the bottom, that is panic selling, real money flowing out.
During a rebound: these few green columns now are sparse and completely low volume.
An increase without the participation of major funds is just playing tricks. The current buying is all retail investors betting on a rebound, and once the major funds press the sell button again, these retail investors will be the first batch of fuel.
I know your hands are itchy, wanting to gamble on a V-shaped reversal. But as a veteran who has lived in this circle for 30 years, I must put the knife to your neck to force you to calm down:
Currently, there are only two scenarios in the market:
Very low probability (bullish): a huge surge breaks through 89,644, and if it pulls back for confirmation without breaking, that would be a good time to enter.
High probability (bearish): blocked in the FVG area of 89,000 - 89,500, completion of baiting, then turning down, breaking through 88,230, heading straight for 86,000.
Strategy for the brothers:
Hold your hands! Chasing longs at this position has a very poor risk-reward ratio.
If you are the hunter, what you should do now is to set up your sniper rifle near 89,500, waiting for that 'exhaustion' signal, rather than rushing in to become the prey.
Remember: in this market, surviving longer is more important than making quick profits.
(Even if you don't believe it now, just bookmark it. After a few hours when you look back, you will come back to thank me.)
