📊 $BICO Short-Term Analysis
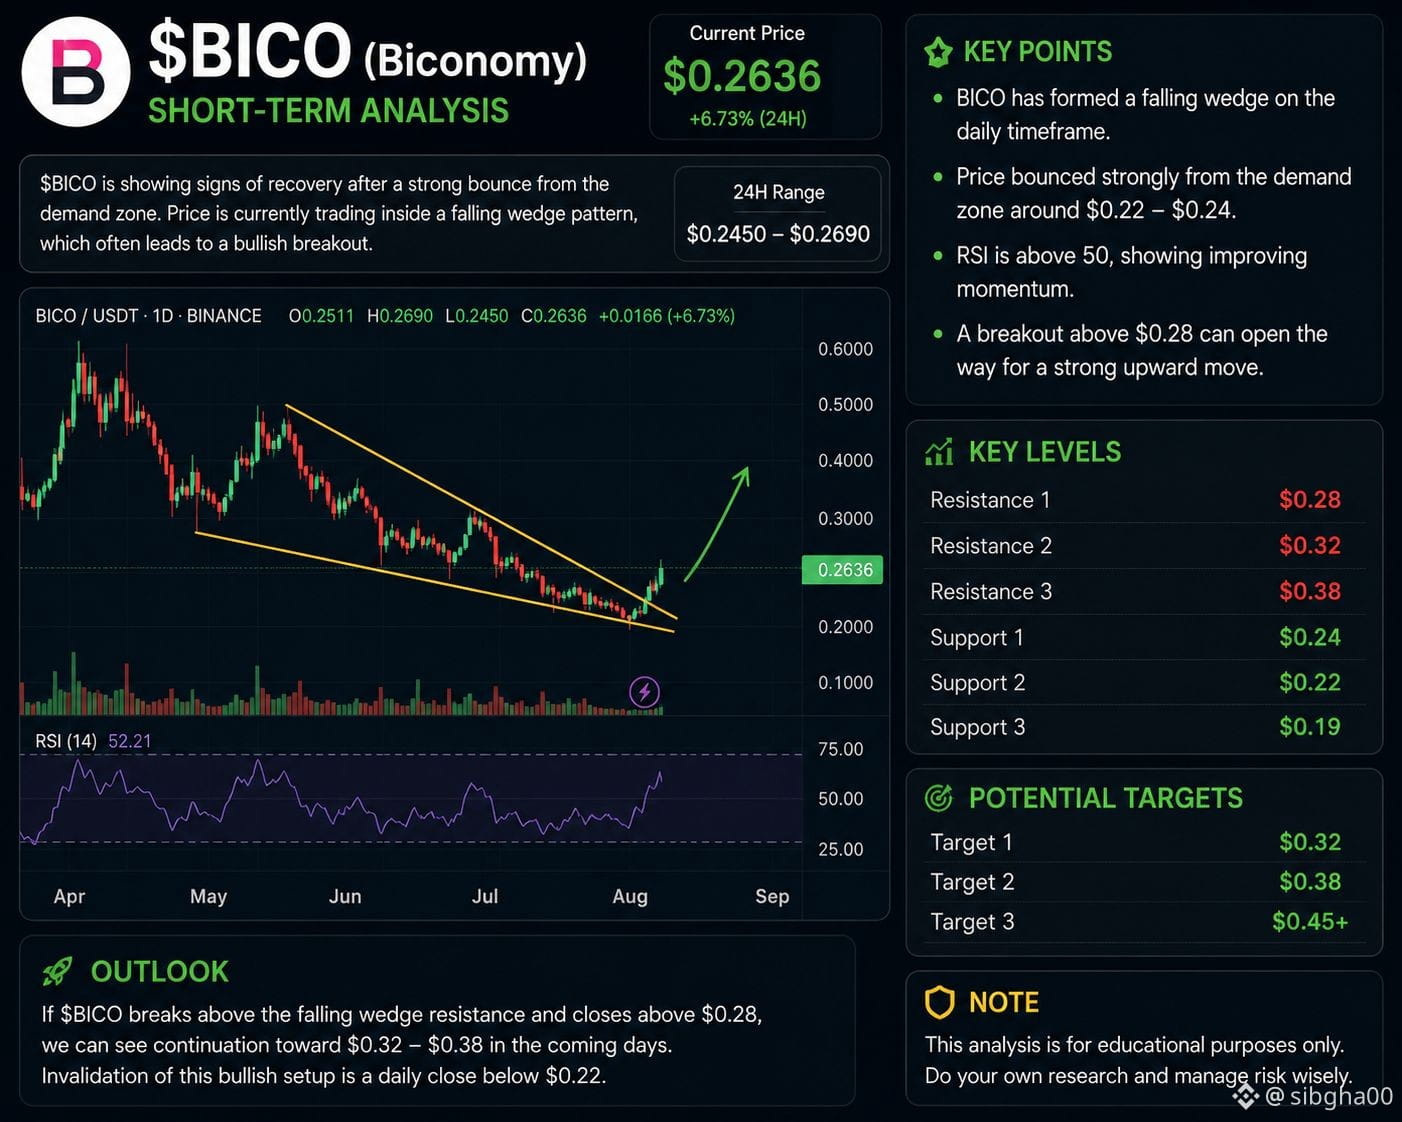
$BICO is showing signs of recovery after bouncing from the $0.22–$0.24 demand zone. The chart is forming a falling-wedge structure, while momentum appears to be improving.
🔹 Key resistance: $0.28
🔹 Breakout target: $0.32 → $0.38
🔹 Extended target: $0.45+
🔹 Key support: $0.24 → $0.22
A strong daily close above $0.28 could confirm a bullish breakout and attract more buying pressure. However, rejection at resistance could lead to another retest of the support zone.#USSolarStocksRisePremarket
#TSEPlansReReviewForMajorBusinessChanges
#SKHynixToInvest19.1TWonInM17Plant
$BICO is showing signs of recovery after bouncing from the $0.22–$0.24 demand zone. The chart is forming a falling-wedge structure, while momentum appears to be improving.
🔹 Key resistance: $0.28
🔹 Breakout target: $0.32 → $0.38
🔹 Extended target: $0.45+
🔹 Key support: $0.24 → $0.22
A strong daily close above $0.28 could confirm a bullish breakout and attract more buying pressure. However, rejection at resistance could lead to another retest of the support zone.#USSolarStocksRisePremarket
#TSEPlansReReviewForMajorBusinessChanges
#SKHynixToInvest19.1TWonInM17Plant