Is gold ($XAU ) preparing for new level tests under the current technical reading?
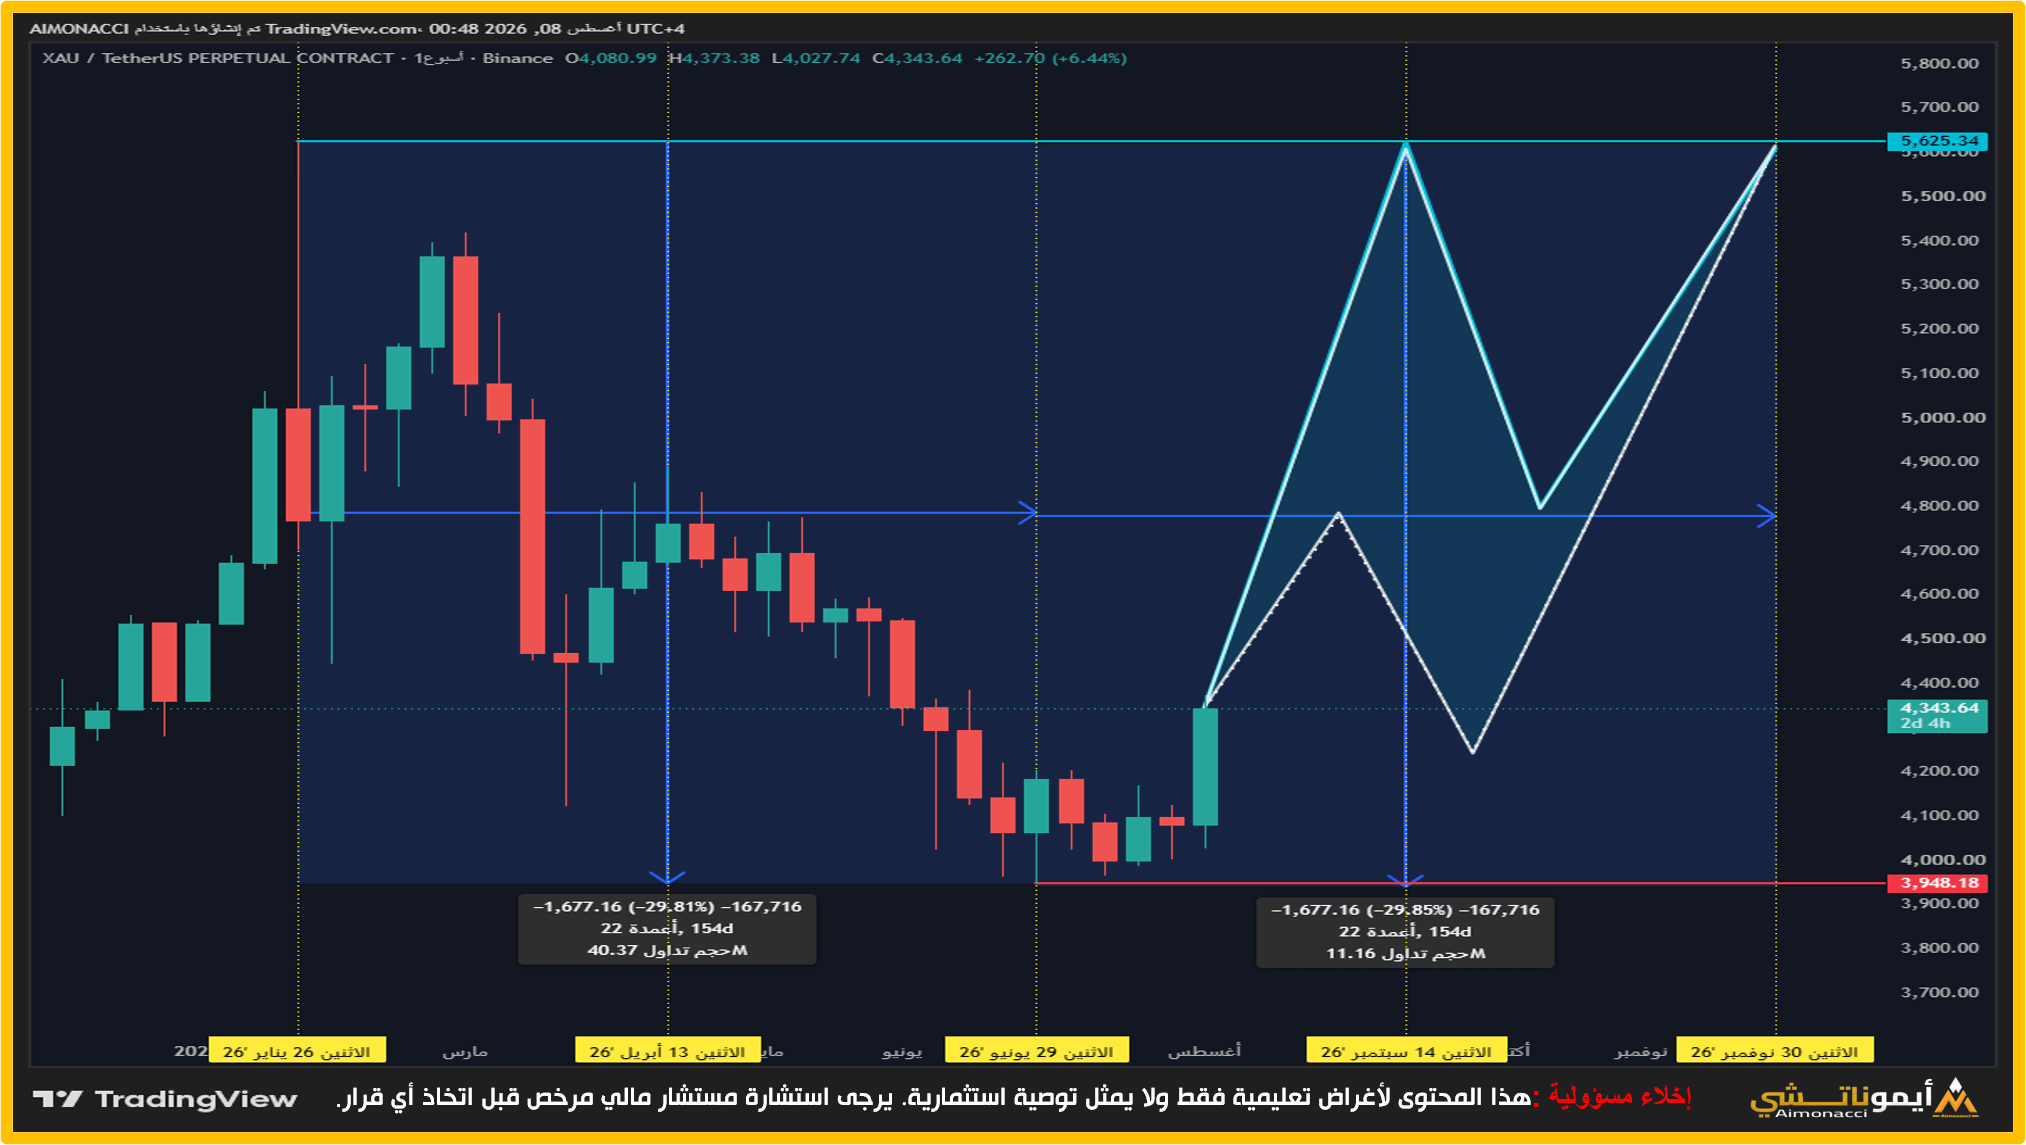
By analyzing the attached chart of the perpetual gold contract (XAUUSDT.P), the price movement appears within a rising technical context that reflects serious attempts to regain positive momentum. The chart shows the price trading at the level of 4,343.64, amid a notable interaction with the plotted price patterns and the anticipated time-based projections.
Key technical observations:
Support levels and demand zones: The key support level at 3,948.18 stands out as a fundamental base that the market monitors to ensure the stability of the current movement and the continuation of buying pressure.
Upcoming technical resistance levels: If the upward momentum continues, the main resistance levels are centered around approximately 4,778.00, reaching the upper target at 5,625.34.
Behavioral and time-based reading: The analysis attached to the chart shows repeating patterns that reflect prior decline ratios and projections for future upward moves linked to precise timeframes such as mid-September and the end of November 2026.
Monitoring the behavior of price closures remains the most important benchmark for assessing how accurately the continuation of the upward path described will hold.
How do you read the technical and time path of gold based on these inputs? Do you expect the price to reach the specified upper levels? Share your opinions in the comments.
#تحليل_فني #الذهب #XAU #AYMONACCI
By analyzing the attached chart of the perpetual gold contract (XAUUSDT.P), the price movement appears within a rising technical context that reflects serious attempts to regain positive momentum. The chart shows the price trading at the level of 4,343.64, amid a notable interaction with the plotted price patterns and the anticipated time-based projections.
Key technical observations:
Support levels and demand zones: The key support level at 3,948.18 stands out as a fundamental base that the market monitors to ensure the stability of the current movement and the continuation of buying pressure.
Upcoming technical resistance levels: If the upward momentum continues, the main resistance levels are centered around approximately 4,778.00, reaching the upper target at 5,625.34.
Behavioral and time-based reading: The analysis attached to the chart shows repeating patterns that reflect prior decline ratios and projections for future upward moves linked to precise timeframes such as mid-September and the end of November 2026.
Monitoring the behavior of price closures remains the most important benchmark for assessing how accurately the continuation of the upward path described will hold.
How do you read the technical and time path of gold based on these inputs? Do you expect the price to reach the specified upper levels? Share your opinions in the comments.
#تحليل_فني #الذهب #XAU #AYMONACCI