


Put the conclusion first.$MU
Micron fell from $1,213 on June 25 to around 880—down 27%. Everyone is discussing whether this is the big top of this storage cycle.
To answer this question more precisely, I went through Micron’s five big tops over the past 30 years, one by one.
Read more history to find the patterns, and to understand the path it took when it came.
I cross-checked everything for each round: the time it topped, the topping pattern, the drawdown magnitude, the duration, the earnings pace, and the prevailing sentiment at the time.
After I finished, my answer is: I’ll slightly adjust the previous conclusion—it's more like a 2024-style dip, not like the 2018-style big top.
This is also my biggest feeling after writing this article late at night.
But judging isn’t what matters—what’s more interesting is the reasoning process. Keep reading.
I. First, look at the big picture account book
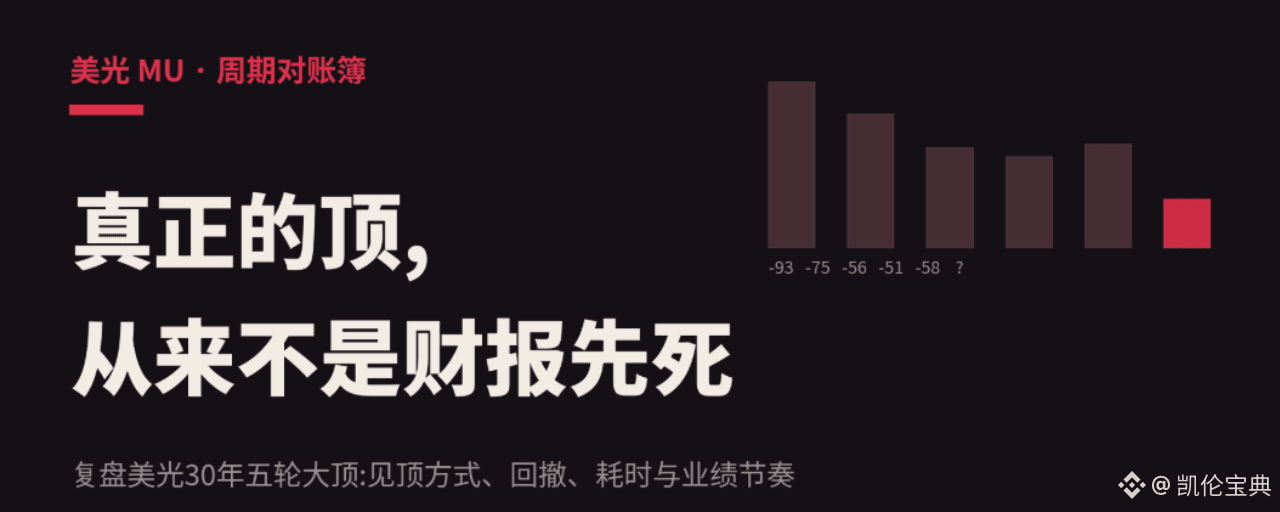
The 2000 internet bubble: topped in July, fell for 31 months, with a maximum drawdown of 93% and three straight years of losses.
2014-16 round: topped on December 8, 2014 at $36.59; fell to $9.31 over 17 months, a 74% drawdown.
2017-18 round: topped at $64.66 by late May 2018; slid to $28.39 over 7 months, a 56% drawdown.
2021-22 round: topped on January 5, 2022 at $98.45; fell to 48 dollars over 9 to 12 months, a 51% drawdown.
It looks like the drawdown is narrowing step by step, right?
93, 74, 56, 51—industry fell from more than a dozen players to a three-player oligopoly. The cycle has indeed been dulled.
But from June 2024 to April 2025, there was a selloff that most people forgot: adjusted-high 152 to adjusted-low 64, down 58%, lasting 10 months.
Deeper than the big top in 2018.
And afterwards it proved it wasn’t a cycle top at all: Micron’s performance kept rising, and the stock rose nearly 19x from that low.
This counterexample is crucial: in the AI era, just looking at how much and how long the market has fallen is no longer enough to distinguish a cycle top from a shakeout.
So how do we tell the difference? By the rhythm of earnings and leading indicators. That’s the core of the multi-round reviews below.
II. 2014-16 round: narrative that ends the cycle, the first bankruptcy
In 2013, Micron acquired Elpida—industry consolidation left only three players.
Back then, the market’s mainstream narrative was: DRAM is left with only three players, and the cycle is dead.
Doesn’t it sound familiar?
Doesn’t it sound familiar?
Doesn’t it sound familiar?
When the stock peaked in December 2014, there was nothing wrong with the earnings report. For FY2015, the full-year EPS was still at a high of $2.7.
Then PC shipments declined. Samsung released 20nm capacity—74% over 17 months.
In the middle, there were rumors of Unigroup acquiring Tsinghua Unisplendour in July 2015, triggering a rebound of over 20%. It trapped a batch of value buyers, and then the market continued to fall for nearly another year.
The lesson from this round: the oligopoly dampens earnings volatility—not stock-price volatility.
III. 2017-18 round: a textbook-like top—lots of details
I suggest saving this round’s timeline.
On May 15, 2018, China’s State Administration for Market Regulation notified Micron to launch an anti-monopoly investigation into it.
On May 21, 2018, Micron announced $10 billion in share repurchase authorization at its New York analyst day, promising to return at least 50% of free cash flow starting the following year.
About 7 trading days later, the stock hit the cycle top at $64.66.
The announcement day for major shareholder returns—7 trading days from the historical cycle top.
More painfully, it’s the earnings rhythm: the stock topped at the end of May, while the peak in single-quarter profit appeared in the quarter from June to August; it wasn’t reported until late September. Single-quarter EPS reached as high as $3.53.
In other words, by the time you confirm the cycle top from the earnings report, the stock price has already fallen for more than three months.
On the emotional front, in the top region, Nomura gave a buy rating, with a target price of $100—back then the stock was at 56.
Wall Street consensus built FY2019 EPS at 11.69, almost the same as 11.77 in 2018—meaning the sell-side model basically had no concept of a downside cycle.
Actually, FY2019 EPS was cut roughly in half to just above 6 dollars; FY2020 was cut again to 2.8.
On valuation, at the top the forward PE was only 5x.
Buy 5x, it still falls 56%, and after it bottoms, it’s still 5x.
Cheap cycle stocks were never a safety net—they’re a standard feature of a cycle top.
IV. 2021-22 round: stock price leads earnings, stretched to 5 months
It topped on January 5, 2022 at $98.45, while the quarterly revenue peak was in the quarter from March to May, at $8.64 billion.
This move this time is even more of an M-shaped top.
The stock-price top led the revenue top by 5 months.
At the top, there was no distinctive bad news. Earnings kept beating expectations consecutively, and guidance was normal.
What broke first?
DRAM spot prices topped as early as March-April 2021, leading the stock price peak by 9 months;
Downstream mobile and PC sell-through started worsening in mid-2021.
Then it was a free fall: quarterly revenue dropped from $8.6 billion to $6.6 billion and then to $4.1 billion; gross margin fell from 46% to 22%. Full-year FY2023 revenue was cut in half to $15.5 billion, net losses were $5.8 billion, and layoffs were 15%.
The lesson from this round: you can see a major top even without bad news. Spot prices and downstream inventory are the whole set of warning systems.
V. 2024-25: that drawdown was even deeper than 2018—why it wasn’t a top
This section is the key to the entire article, because if I say this round is like that, I have to explain it clearly.
In June 2024, Micron surged to a high of $157 in the first wave of the HBM cycle.
Then it fell for 10 months, reaching a low around 60 in April 2025, a 58% drawdown on an adjusted basis.
It’s two points deeper than the real cycle top in 2018.
What happened during those 10 months of review?
In September 2024, Morgan Stanley’s famous “The coming winter is coming” piece called that the memory cycle was topping out. It directly crushed the sector, and Micron fell to below 85 at one point.
At the same time, the consumer end truly deteriorated: storage demand for PCs and phones weakened. From late 2024 to early 2025, consumer-grade DRAM and NAND prices actually dropped meaningfully, and Samsung and Hynix even reduced NAND production.
In April 2025, the final kick came from tariff shocks, smashing out a bottom around 60 dollars.
Pay attention—back then, every reason for the bearish view wasn’t made up: the sell-side called the top, consumer-grade prices truly fell, and macro things really went wrong.
Then why isn’t it a cycle top?
Because the price curve that determines Micron’s profits changed.
When consumer-grade memory prices fell, the contract prices for HBM and server DRAM stayed basically unchanged. HBM capacity was sold out in advance, and data-center revenue kept rising quarter after quarter.
The profit engine has switched from consumer-grade products to AI memory, while the market is still using consumer-grade thermometers to take the company’s temperature.
The result is: earnings kept setting new highs, and the stock surged from the April lows to this June’s highs—up by nearly 19x.
This section provides two lessons—worth more than the first three rounds combined.
First, after AI rewrote the earnings structure, the depth of drawdowns completely lost its ability to discriminate. 58% could just be a mid-slope dip.
Second, watch the prices with the right thermometer. The line between life and death this round is the prices of server DRAM and HBM—not consumer spot prices. The consumer-grade price drop in 2024 didn’t kill the cycle; future consumer-grade price increases can’t rescue the cycle either.
So the only question to ask about this round’s 27% decline is: did the reason for the selloff actually affect the server DRAM and HBM curve?
At present, the answer is: none. ChangXin’s capacity is aimed at consumer-grade, and cloud companies are still fighting to secure AI memory. That’s all the basis for saying this is like 2024—panic concentrated on the wrong thermometer.
[As the market learns, the stock top runs earlier and earlier]
VI. Put the three rounds together—three rules
First rule: the stock-price top always leads the earnings top, and the leading period lengthens with each cycle.
Leading by 2 to 3 months in 2014, 3 months in 2018, and 5 months in 2022.
The reason isn’t complicated: the market is learning. More and more money wants to run ahead of the cycle, and once people are racing, they run earlier and earlier.
Inference: if a top forms this round, the stock-price top could lead the earnings top by 6 to 12 months. By the time earnings confirm, you are effectively waiting for the stock to finish falling half of the way first.
Second rule: the signal package for major tops is highly consistent.
Record performance, record gross margin, and announcements of large buybacks or dividends. At the top, the sell-side built the next year’s numbers into a flat plateau, and then added a narrative that this time is different.
The 2014 version was called ending the cycle through consolidation; the 2018 version was called data-center structural demand.
Third, leading indicators have a strict lag order.
Downstream sell-through and customer inventory lead by 6 to 12 months.
Spot prices lead by 0 to 9 months.
Then comes the stock price.
Contract prices lag by 3 to 5 months. Earnings reports lag by 3 to 8 months.
Contract prices and earnings are confirmation indicators, not warning indicators. Using earnings to time the cycle is like driving with a rearview mirror.
VII. Compare with today: scoring card
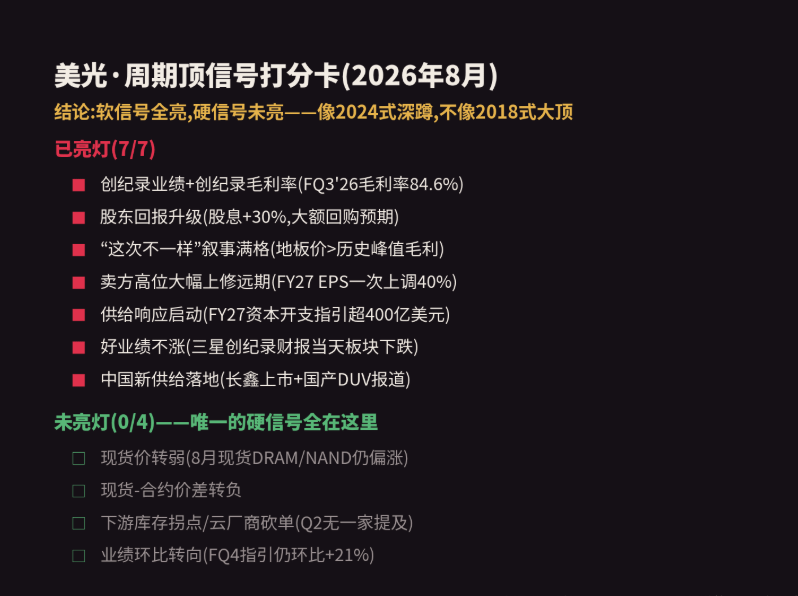
Now put Micron as of August 2026 into this signal package and score it point by point.
The ones that have already lit up:
✅ Record performance. FQ3 revenue was $41.46 billion, up 346% year over year. Gross margin was 84.6%, versus 61% at the big top in 2018.
✅ Upgraded shareholder returns. Dividend increased by 30%, and the market expects buybacks of up to several tens of billions in FY2027. A mirror of May 2018.
✅ This time’s narrative is fully “different.” The gross margin associated with the floor price in long-term agreements is higher than the peak of any historical cycle. The Wall Street line is that the historical ceiling has become today’s floor. Customers paid $18 billion in cash deposits plus $4 billion in letters of credit.
✅ Sell-side upgrades from the high point. Morgan Stanley raised its FY2027 EPS forecast in one go by 40% to $168. Bank of America says in the bear-case scenario for 2028, EPS is still $100—compared with only $12 at the prior cycle peak.
✅ Supply response has already started. Capex of $27 billion in FY2026, and mid-point guidance of over $40 billion in FY2027—close to doubling. Historically, the three major fabs’ capex has moved up together, leading the cycle top by 12 to 24 months.
✅ Good performance doesn’t lift the stock. In early July, Samsung posted a record earnings report; that same day, the storage sector still sold off. A mirror of September 2018.
✅ New supply in China is landing. Reports on ChangXin’s IPO and domestically made DUV lithography machines; Apple has been rumored to be testing chips from ChangXin.
The ones that didn’t light up:
❌ Spot prices haven’t weakened yet. In early August, spot DRAM and NAND are still steady-to-slightly rising. TrendForce’s guidance for Q3 server DRAM contract prices implies a month-over-month increase of 13 to 18 percentage points.
❌ The price spread between spot and contracts hasn’t turned negative.
❌ No inventory inflection at the downstream. In Q2 earnings from the four major cloud companies, they admitted components are becoming more expensive, but none said AI deployment is constrained by memory. H100 rental prices are still near historical highs.
❌ Earnings direction is still upward. Next-quarter guidance is $50 billion, up another 21% month over month.
Did you see it clearly? Soft signals were all on; not a single hard signal was on.
And historically, whenever there was a true major top, spot prices started to weaken 0 to 9 months before the peak.
Either it never topped, or if it did, it’s this time—and the people who ran have moved even faster.
VIII. My view
My speculative take: June 25 might not be the major cycle top for this round. This 27% pullback in nature is more like the mid-stage deep squat of 58% in June 2024, rather than the cycle top in May 2018. Even so, it’s still quite possible the correction goes back into the 500 to 600 range. If that’s the case, then it would still be a top.