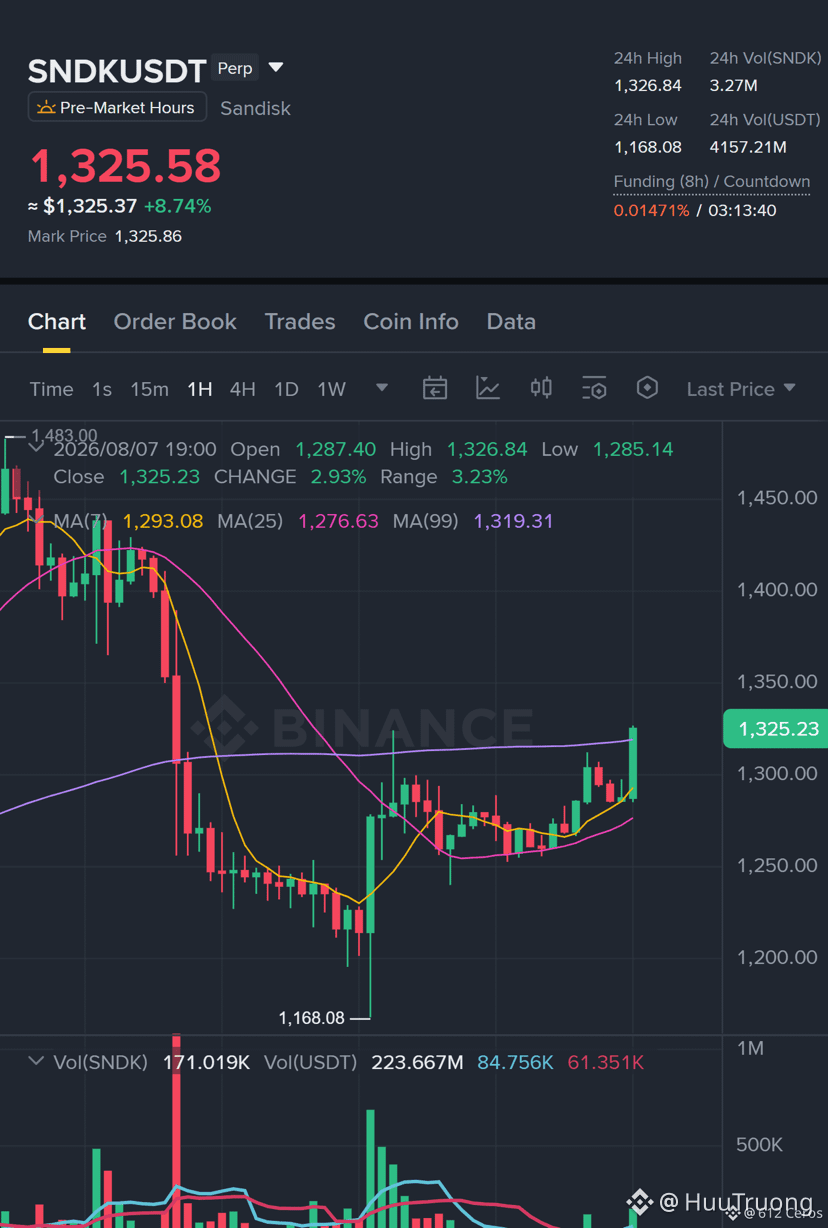
Everyone is focused on the 4H breakout while the 1D chart quietly refuses to follow the trend.
$SNDK /USDT - LONG
Trading plan:
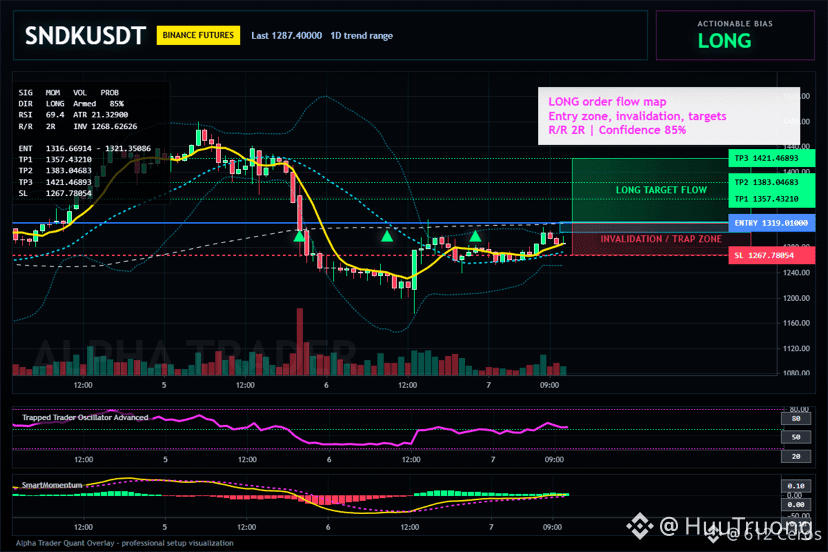
Entry: 1316.66914 – 1321.35086
SL: 1267.78054
TP1: 1357.43210
TP2: 1383.04683
TP3: 1421.46893
Why this setup?
- $SNDK “is equipped” with a LONG order with 85% confidence, but the daily timeframe range suggests this is a scalper’s game—not the holders’ dream.
- RSI on the 15m chart is at 69.44—momentum is hot, but it hasn’t run out yet; the 4H structure is pushing toward TP1 (1357) before the daily timeframe’s upper-band interferes.
- Why now? ATR on the 1H chart is 21.3, giving us a “tight handcuff”: enter at 1319, invalidated at 1268. The edge (+5.8) is real, but only if you stick to your stop-loss.
Debate:
Are you overpowering the daily timeframe’s range, or riding the 4H momentum to reach TP2?
Click here to trade 👇️
$SNDK /USDT - LONG
Trading plan:
Entry: 1316.66914 – 1321.35086
SL: 1267.78054
TP1: 1357.43210
TP2: 1383.04683
TP3: 1421.46893
Why this setup?
- $SNDK “is equipped” with a LONG order with 85% confidence, but the daily timeframe range suggests this is a scalper’s game—not the holders’ dream.
- RSI on the 15m chart is at 69.44—momentum is hot, but it hasn’t run out yet; the 4H structure is pushing toward TP1 (1357) before the daily timeframe’s upper-band interferes.
- Why now? ATR on the 1H chart is 21.3, giving us a “tight handcuff”: enter at 1319, invalidated at 1268. The edge (+5.8) is real, but only if you stick to your stop-loss.
Debate:
Are you overpowering the daily timeframe’s range, or riding the 4H momentum to reach TP2?
Click here to trade 👇️