Here is the short analysis and chart for BNB/USD:$BNB
BNB/USD Technical Analysis
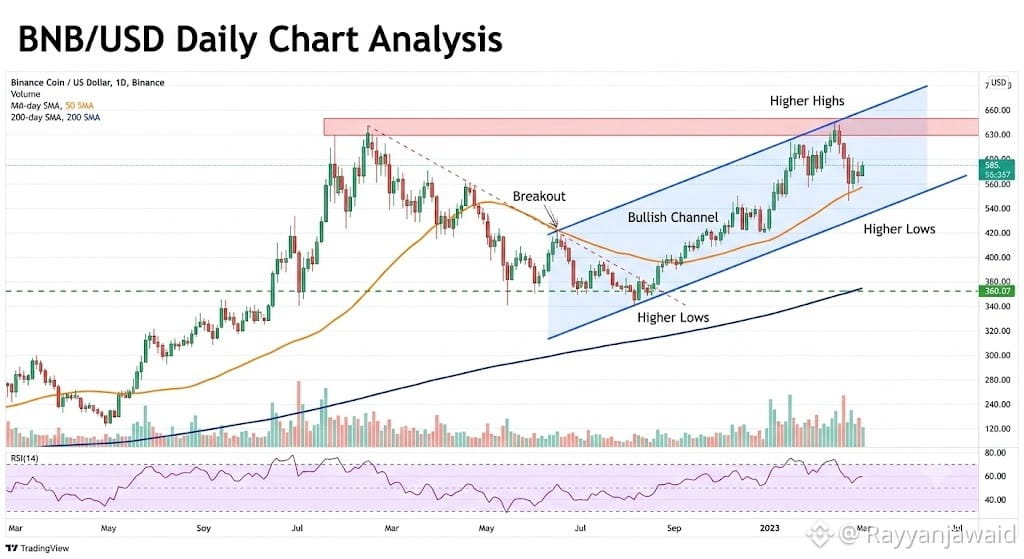
The daily chart for Binance Coin (BNB) against the US Dollar shows significant positive momentum. Having successfully broken above a major downward trendline (red dashed line) in late 2023, BNB price action has since been defined by a clear, expanding bullish channel.
Key indicators suggest a strong uptrend:
Trend Confirmation: The price is consistently printing higher highs and higher lows, respecting the lower boundary of the rising channel.
Moving Averages: The short-term 50-day moving average (orange line) crosses significantly above the 200-day moving average (blue line)—a classic "Golden Cross" signal. Both averages are sloping upwards and now act as dynamic support.
Volume and RSI: The breakout was confirmed by robust trading volume. The Relative Strength Index (RSI) is currently hovering around 65, which indicates strong bullish momentum but remains below the 'overbought' threshold (70), suggesting there is still room for further upside.
Conclusion: The outlook for BNB remains bullish. The structure within the ascending channel suggests that as long as the price remains above the critical support zone of $350-$360 (defined by the recent swing low and the 50-DMA), the path of least resistance is upward, with next target objectives near the channel's upper boundary.

#TSEPlansReReviewForMajorBusinessChanges #DollarSetForBestDayInTwoWeeks #GoldBreaksOutFromJanuaryDowntrend #USSenateNoClarityActVoteBeforeAugustBreak
BNB/USD Technical Analysis
The daily chart for Binance Coin (BNB) against the US Dollar shows significant positive momentum. Having successfully broken above a major downward trendline (red dashed line) in late 2023, BNB price action has since been defined by a clear, expanding bullish channel.
Key indicators suggest a strong uptrend:
Trend Confirmation: The price is consistently printing higher highs and higher lows, respecting the lower boundary of the rising channel.
Moving Averages: The short-term 50-day moving average (orange line) crosses significantly above the 200-day moving average (blue line)—a classic "Golden Cross" signal. Both averages are sloping upwards and now act as dynamic support.
Volume and RSI: The breakout was confirmed by robust trading volume. The Relative Strength Index (RSI) is currently hovering around 65, which indicates strong bullish momentum but remains below the 'overbought' threshold (70), suggesting there is still room for further upside.
Conclusion: The outlook for BNB remains bullish. The structure within the ascending channel suggests that as long as the price remains above the critical support zone of $350-$360 (defined by the recent swing low and the 50-DMA), the path of least resistance is upward, with next target objectives near the channel's upper boundary.

#TSEPlansReReviewForMajorBusinessChanges #DollarSetForBestDayInTwoWeeks #GoldBreaksOutFromJanuaryDowntrend #USSenateNoClarityActVoteBeforeAugustBreak