Sister U 8.7$BTC Market Surface Analysis
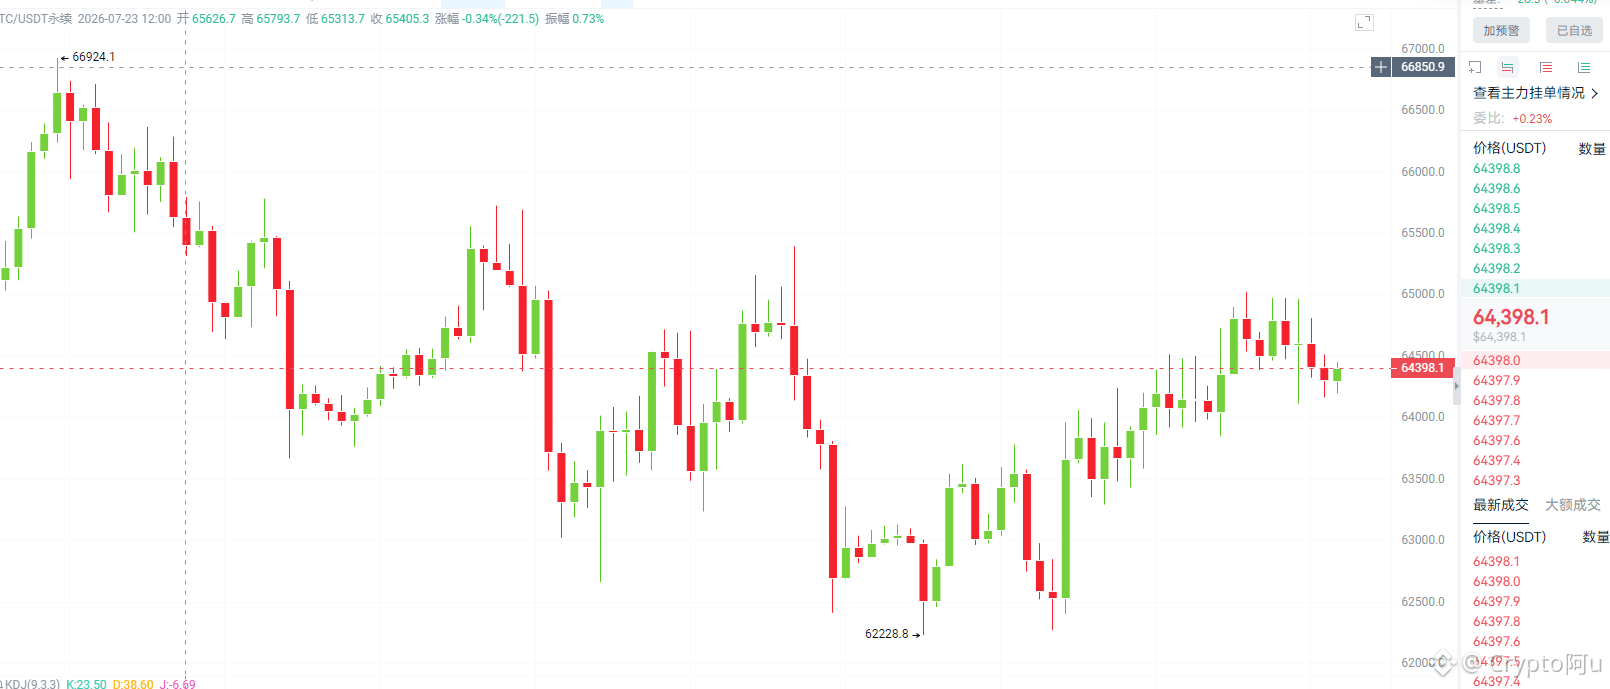
4-hour cycle: In the early phase, the prior peak at 66924 was pressured and pulled back. The phase low at 61806 formed a bottom support, and overall the market continues to trade within a broad range-bound box oscillation.
Current price is around the middle of the range. The KDJ indicator shows K at 59.48 and D at 66.38. The K value is turning downward, with signs of a bearish cross and a pullback. Short-term bullish momentum is gradually weakening.
The market is repeatedly churning with no clear single-direction trend. Do not chase highs or cut lows; operate only near the edges of the range.
Sell on rallies (high short)
Entry: 64600–65000 resistance zone
Stop loss: 65520. If price breaks above the previous high resistance, abandon the short.
First take profit: 64000; second take profit: 63700–63300
4-hour cycle: In the early phase, the prior peak at 66924 was pressured and pulled back. The phase low at 61806 formed a bottom support, and overall the market continues to trade within a broad range-bound box oscillation.
Current price is around the middle of the range. The KDJ indicator shows K at 59.48 and D at 66.38. The K value is turning downward, with signs of a bearish cross and a pullback. Short-term bullish momentum is gradually weakening.
The market is repeatedly churning with no clear single-direction trend. Do not chase highs or cut lows; operate only near the edges of the range.
Sell on rallies (high short)
Entry: 64600–65000 resistance zone
Stop loss: 65520. If price breaks above the previous high resistance, abandon the short.
First take profit: 64000; second take profit: 63700–63300