

I have been trading cryptocurrencies for over ten years now, going from liquidation to achieving financial freedom. I support my family through trading, and in 2024, my capital increased by 50 times. If it weren't for withdrawing funds twice to buy a house, it should have been an 85-fold increase.
Today I will share my trading strategies and insights with my friends in the cryptocurrency circle. There is a saying that goes, standing on the shoulders of giants can save you ten years of hard work. At the end of the article, I will also talk about the most important aspect of position management. For those who are fortunate enough to see this and want to improve their cryptocurrency trading skills, be sure to read more and study carefully; I suggest saving this!
When I first entered the cryptocurrency circle, I was still a worker, starting my journey with 2000u. The reason it was 2000u is that the OKEx USDT spare fund offers an annual interest rate of 10%. However, each account can only invest a maximum of 2000u, which should be called simple coin earning. At that time, I hoped to make some money, and a friend suggested I convert the money into u and deposit it into OKEx's spare fund. This friend of mine is from a wealthy family, and he started trading cryptocurrencies early, constantly bragging about how much he earned yesterday and how much he earned today, also showing us his profit charts, which often showed multiple times the returns.
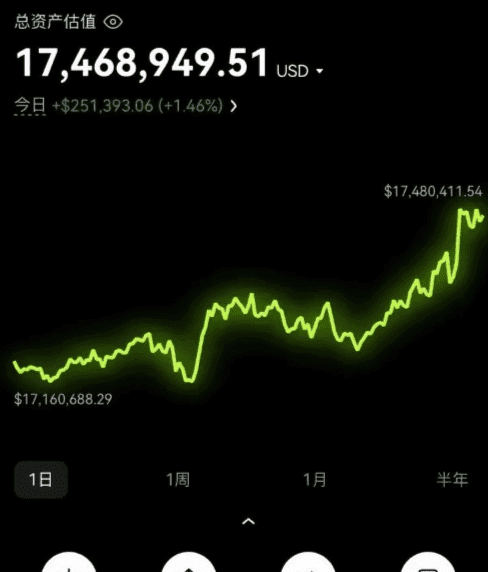
Actually, I knew about cryptocurrencies a long time ago, and decided to give it a try. At the time, I thought the interest rate would be three or four times higher than Yu'ebao (a popular Chinese money market fund).
At that time, I was penniless, and my meager savings amounted to exactly 2000 USDT, with 1000 USDT set aside for food. So I registered an Ouyi account and converted all the money in my Alipay account into USDT, depositing it into YuBiBao. The cryptocurrency market was in a bear market back then.
In the market, I see that almost all cryptocurrencies on the software are falling daily, and my friend is constantly shouting to short them, and he's made quite a bit of money. Although YuBiBao (a cryptocurrency trading platform) is profitable...
The interest rates were quite high, but since my principal was only a little over ten thousand, my daily earnings were barely enough to buy a bottle of soda. Seeing my friend making a fortune by short selling, I asked him to teach me how to trade contracts. In reality, contracts are extremely simple, just like gambling on dice.
Back then, I was a gambler, and my first trade after learning how to use the gambler's tools was with maximum leverage. My first trade was shorting a low-quality cryptocurrency. I went to sleep after placing the order that night, and when I woke up and saw that my account was profitable, I immediately closed the position. This trade brought me a profit of over 200 USDT, which is more than the annual profit from YuBiBao (a cryptocurrency trading platform).
At the time, I felt like the money had fallen from the sky, so I immediately transferred all the money from my YuBiBao account to my contract account and started my...
My career in contract trading. Back then, I studied candlestick charts and technical indicators, browsed various news articles, joined all sorts of contract trading groups, and listened to the trading advice given by those who provided trading signals.
That's just nonsense. Aside from sleeping, attending classes, and eating, I spend the rest of my time watching the market. My position management involves 25% of my capital with 10x leverage.
To proceed, besides the normal method of opening positions based on candlestick charts, I have a special method: I followed my friend's account on EuroEasy.
I receive notifications whenever he opens a position. My friend is actually a novice when it comes to trading; he brags to me when he makes money, and then...
He remained silent, and overall, he didn't make any money; in fact, he lost money more often than he gained. If I had followed his trades, I would have basically lost more than I won, but I also...
Instead of trading against him, I prefer to enter the market when he's cutting his losses. I must say, this strategy has a remarkably high win rate; you could say I...
They started using contrarian indicators very early on.
I'm no different from most people; I'm not suited for trading. I not only like holding onto losing positions, but I also prefer adding to losing positions and rarely use stop-loss orders. However, perhaps due to...
During my beginner protection period, I was incredibly lucky; I managed to break even every time I held a losing position, maintaining a win rate above 90% (at that time, I paid special attention to...).
(Win rate), and I even considered making money by leading trades. In about a month, my 2000u increased 30 times, reaching 60000u. I started from...
My novice skills have improved to the point where even my seasoned investor friend has to learn a few tricks from me. But my friend is the type who learns bad techniques instead of good ones.
They don't learn indicators or anything like that, still relying on gut feeling to place orders, while their copycats are learning from me quite well! Soon, yours? Actually, I know...
What will be the final outcome of the contracts? My initial goal was to reach 100,000 units and then stop playing contracts, only buying spot.
After successfully reaching 100,000 USDT, the next goal is to reach 300,000 USDT, at which point I will stop trading contracts and only buy spot. The third goal is to reach...
He planned to buy more spot goods once he reached 500,000 USDT, with the fourth target being even higher. One night, a friend suddenly messaged him saying that all the USDT in his account had been liquidated.
That's it, he got liquidated before he even had a chance to add more margin. I could only offer a few words of comfort, glance at the Qin coin he had opened an order for, and immediately...
He opened a short position 20 times above the liquidation price. Not long after, the coin plummeted, and I continued to short it.
A week later, my assets had nearly increased tenfold, reaching 600,000 USDT. Feeling that shorting was too risky, I closed my positions and returned my initial investment.
I withdrew my initial 2000 USDT investment in cryptocurrency, splurgeed on food and drinks for a few days, and even bought an iPhone. Since I'd already withdrawn the initial investment, at least I hadn't lost anything; it was just a few months of wasted effort. But at the time, I was like a gambler, blinded by greed, and immediately sold my newly purchased phone...
I put all my old laptops and other devices on Xianyu (a second-hand marketplace) to sell, which helped me raise some money. Following a friend's advice, I bought a "Ten Dogs" (a type of in-game currency), but naturally, it all went to the mother (the player's mother).
For a while, I was completely dazed. It happened to be my university final exams, and when the exam paper was handed out, my mind went blank. When it was time to hand in the paper early, I haphazardly filled in the multiple-choice questions and handed it in, forgetting even to fill in my exam number. I basically failed all the courses I was going to fail, and my life suddenly felt directionless. Fortunately, I've never liked borrowing money from others, and I never touched anything like online shopping scams, which is a key reason why I was able to get back on my feet. What doesn't kill you makes you stronger; after surviving that low period, I started looking for other opportunities.
By chance, I met a group of people in an airdrop group who specialized in USDT arbitrage and errand running, which introduced me to the concept of a broker.
The industry. Through gradual learning, I gained a lot. So I prepared several thousand USDT, and every day I ran errands and bought some spot goods, saving some money. I ran 200,000 USDT alone. To this day, I haven't touched contracts again, and everything feels positive.
This is the direction I'm sharing. The point is that failure isn't scary; there are many opportunities in the crypto world, not just futures contracts. If one doesn't work, switch to another; never give up. These include airdrops, NFTs, accumulating coins, DeFi, quantitative trading, various arbitrage opportunities, arbitrage, and brokerage services, among others.
Focusing on only one trading pattern, entering the market only when the opportunity is clear, and never trading without a clear pattern, this strategy has maintained a win rate of over 90% for five years! If your account is less than 1 million and you want to profit in a short period, there is indeed a timeless trading strategy in the cryptocurrency world that you should definitely try.
"Foolproof techniques" that retail investors can easily master at a glance—purely practical tips!
34 classic candlestick patterns explained – the most comprehensive collection ever, a must-have for any collector!
Is it possible to make a profit simply by memorizing all candlestick patterns?
Not necessarily. While candlestick charts (or K-lines) are widely popular due to their trendy appeal, they are not a magic bullet for profits. Traders are often intelligent and...
Overconfident, he believed that he could crack the "wealth code" by studying technology.
However, there's a famous saying in the market: "Believing in candlestick charts is like gaining eternal life."
Candlestick charts contain a wealth of market information, and understanding this information can lead to success in trading. However, different people interpret candlestick charts differently.
When candlestick patterns are difficult to interpret, some traders rely on technical indicators to bolster their confidence. Others, however, choose to trade "naked candlesticks," relying on their intuition to profit.
To help traders better understand candlestick charts and improve their trading skills, we have compiled 34 common candlestick patterns in the market, hoping to provide a practical reference for your trading operations.
What are candlestick patterns?
Candlestick patterns are charting tools used to visually represent price fluctuations; they show the price action of a particular stock or financial asset.
The opening price, closing price, highest price, and lowest price within a specific time period. Each candlestick consists of a body and shadows, where the body represents the opening price.
The shadows represent the price changes between the closing price and the closing price, while the shadows reflect the highest and lowest prices during that period.
Traders can identify buying or selling opportunities by observing these patterns. For example, based on specific candlestick (or combination) patterns,
Traders can determine whether the market trend is upward or downward, and thus decide when to enter or exit the market.
Candlestick charts not only provide crucial information about market trends, but also help traders identify support and resistance levels, recognize reversal signals, and understand overall market sentiment. They are especially useful when market volatility is high and traditional analysis methods are not intuitive enough. Mastering candlestick charts...
By understanding line patterns and their significance, traders can develop trading strategies with greater confidence and gain an advantage in the market.
How to interpret candlestick chart information?
Candlestick charts are a powerful tool for analyzing market trends. Their intuitive presentation makes it easier for traders to understand price changes and make buying and selling decisions accordingly.
Each candlestick represents a specific time period, such as a day or an hour, and includes four key prices: opening price, closing price, highest price, and lowest price.
If the opening price is lower than the closing price, the candlestick is usually green or white (the opposite is true in the Chinese market), indicating a price increase.
◆If the opening price is higher than the closing price, the candlestick is usually red or black (the opposite is true in the Chinese market), indicating a price decline.
The body of a candlestick represents the price change from opening to closing, while the shadows show the highest and lowest prices during that period. Longer shadows indicate greater price volatility.
To understand candlestick charts, you need to not only understand their basic components but also learn common patterns such as doji, hammer, and spinning top. These patterns can reveal potential trend changes in the market. When used in conjunction with other technical analysis tools, candlestick charts can help traders make more accurate decisions and seize trading opportunities.
Single candlestick pattern
In stock market trading, single candlestick patterns are one of the essential concepts to master. A single candlestick pattern consists of only one candlestick.
Chart patterns, often used to predict future price movements and volatility.
There are four main types of single candlestick patterns, each of which provides important information about market direction and momentum:
Bullish engulfing pattern: This pattern appears after a bearish candlestick is followed by a larger bullish candlestick, indicating that buyers are in control.
• Bearish engulfing pattern: This is the opposite of the bullish engulfing pattern. It appears after a bullish candlestick followed by a larger bearish candlestick, indicating that sellers are in control.
Hammer candlestick pattern: This pattern appears after a very long lower shadow, followed by a candlestick with a small body and almost no upper shadow, indicating strong buying pressure and suggesting that the price may rise in the short term.
• Shooting Star Pattern: This pattern appears after a very long upper shadow, followed by a candlestick with a small body and almost no lower shadow, indicating strong selling pressure and suggesting that prices may fall in the short term.
These patterns are just a small fraction of the many patterns in technical analysis. While they can help identify potential price movements, it's important to remember that these patterns are not a guarantee of price action. Traders must closely monitor current market conditions and adjust their strategies accordingly.
1. Cross (Deji)
A doji is a candlestick pattern formed when the opening and closing prices are the same or very close. It indicates that the market is in a state of hesitation and may suggest the potential for a trend reversal.
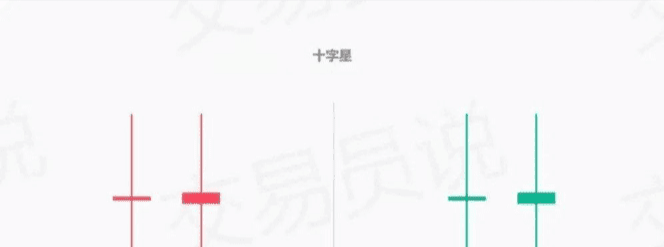
A doji candlestick pattern is generally seen as a signal of a balance between bullish and bearish forces, thus indicating an unclear market direction. A doji can also confirm an existing trend, typically appearing after a longer trend or as part of a long-term trend. Furthermore, a doji may also suggest the end of a trend or the beginning of a new one.
As with any chart pattern, the Doji needs to be confirmed with other indicators (such as volume, momentum, or trend lines) before making a trading decision. With proper analysis, the Doji can be a powerful tool for traders.
2. Hammer line
The hammer candlestick pattern is a candlestick pattern with a small body and a long lower shadow, indicating that in a downtrend, buyers intervene and drive the price back up.
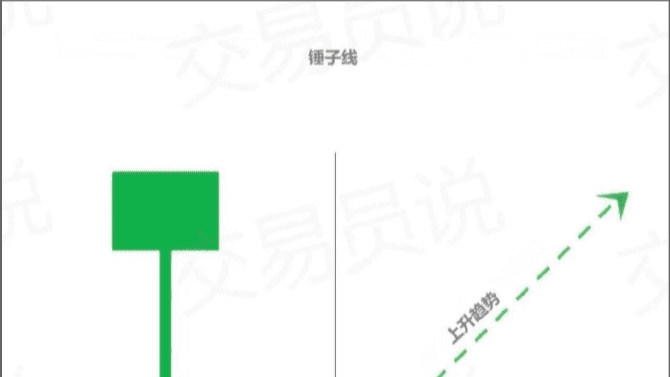
The hammer candlestick pattern is considered a bullish reversal pattern. Its appearance indicates that the bears' control over the price is weakening, and buyers are driving the market rebound. This may also suggest a market bottom or a trend reversal. Traders should observe for confirmation signals before taking any action.
Confirmation signals may come from other indicators, such as trading volume or moving averages. If the pattern is confirmed, traders can enter a long position when the market rebounds.
A hammer candlestick pattern typically consists of a single candlestick and requires confirmation from other indicators before taking action. It's important to remember that a single indicator is insufficient for comprehensive reliance; traders should combine multiple analytical tools to make informed decisions.
If the hammer candlestick pattern is confirmed, traders should also pay attention to the size and shape of the candlestick; a large candlestick with a wide lower shadow may indicate that the price...
There is strong buying pressure at this level, which may indicate a potential market bottom.
3. Hanging Man
The Hanging Man is a reversal pattern of the Hammer candlestick. It has a small body and a long lower shadow, but it appears after an uptrend and may indicate that the trend will reverse into a downtrend. When a Hanging Man appears, investors should be aware of market risks.
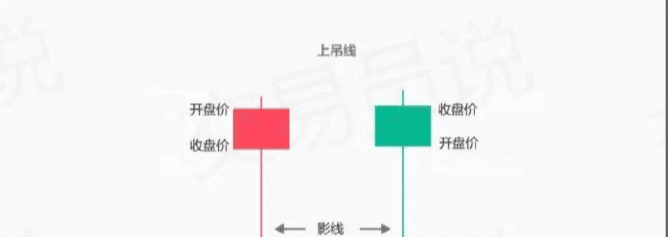
Technical analysts often use the hanging man pattern to identify potential trend reversals, helping investors decide whether to enter or exit a trade.
The key is to remain vigilant about the market, because no one can predict price movements with 100% certainty.
The hanging man candlestick pattern has a long lower shadow and no upper shadow (or a very short upper shadow). The body is small and located at the upper end of the trading range. The hanging man candlestick pattern is very similar to the hammer candlestick pattern.
The difference is that it appears in an uptrend, which generally indicates that the uptrend is about to end.
The shadow of a hanging man candlestick pattern is usually twice as long as the body.
4. Inverted Hammer
The inverted hammer candlestick pattern is similar to the hammer candlestick pattern, but it appears after a downtrend. It has a small body and a long upper shadow, indicating that buyers are starting to enter the market.
This drives prices up; however, by the time the transaction ends, the seller pushes the price down again.
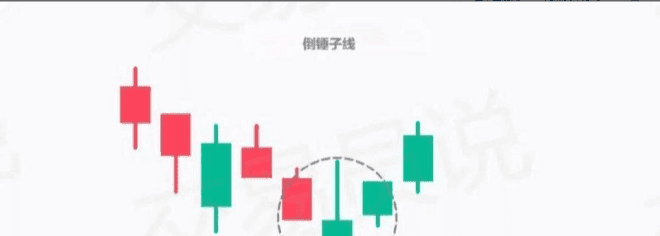
An inverted hammer candlestick pattern can be seen as a signal that buyers are interested and a new upward trend may soon begin.
5. Shooting Star
A shooting star is a candlestick pattern with a small body and a long upper shadow that appears after an uptrend and may indicate a trend reversal to a downtrend.
Downtrend. This pattern forms when the opening and closing prices are close, but the highest price exceeds the price level of the previous period.
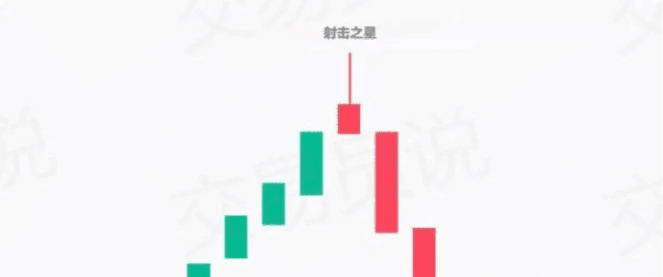
A shooting star pattern indicates that traders are willing to pay higher prices at the beginning of a cycle, but subsequently encounter strong selling pressure. Therefore, this bearish signal may mean that the uptrend is no longer supported and a downtrend may be beginning.
Investors should wait for confirmation of this bearish trend before taking action, as shooting stars are sometimes just a brief pause in a strong uptrend.
If a shooting star pattern appears near a resistance level, it may also indicate a potential reversal.
6. Observe Zhang's engulfing pattern (Bullish Engulfing)
When a bullish engulfing pattern appears, a small bearish candlestick is followed by a larger bullish candlestick, which completely engulfs the former. This may indicate a potential trend reversal to an uptrend.
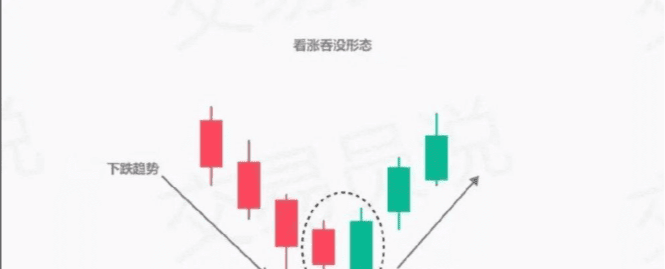
If this pattern appears in a downtrend, it is considered a bullish signal, indicating that buyers have taken over the market and are driving prices up.
Traders should enter a trade only after confirming a trend reversal and place a stop-loss order below the low of the engulfing candlestick to prevent losses.
If traders want further confirmation of a reversal, they can observe the highs and lows over the next few days.
This pattern is very important for traders, as it usually indicates that prices will rise significantly.
7. Bearish Engulfing Pattern
A bearish engulfing pattern is the opposite of a bullish engulfing pattern. A bearish engulfing pattern occurs when a small bullish candlestick is followed by a larger bearish candlestick, and the latter completes...
When the previous element is completely engulfed, a bearish engulfing pattern is formed. This may indicate that the trend may reverse into a downtrend.
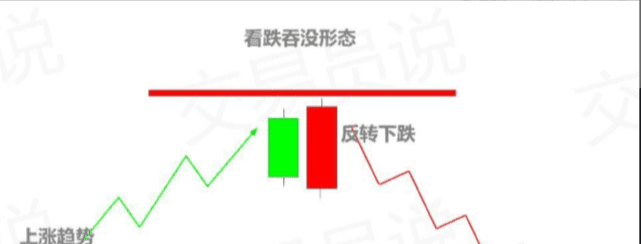
This pattern could be a signal of weakening uptrend, indicating increasing selling pressure. To confirm the bearish engulfing pattern, traders should...
Wait for the price to close below the lower boundary of the second candlestick. It is crucial to take action before this signal is confirmed.
8. Gravestone Doj
A gravestone doji, characterized by a long upper shadow and no lower shadow, indicates that prices opened and closed at the same level. Its appearance after an uptrend may suggest a trend reversal to a downtrend.

However, it could also indicate temporary hesitation between buyers and sellers. Traders should wait for the trend to be confirmed before entering a trade.
The Gravestone Doji can be used in conjunction with other technical analysis indicators such as support and resistance levels and moving averages to help identify potential downside risks.
There are trading opportunities.
Double candlestick pattern
The two-candlestick pattern is a chart pattern used by technical traders to identify potential trading opportunities. It consists of two candlesticks, one representing...
One candlestick represents the opening and closing prices for a given period, while another represents the highest and lowest prices for the same period. The shape of a candlestick indicates the value of a particular asset.
Prices may rise or fall in the near future.
Through careful analysis, traders can use this information to decide whether to enter or exit a trade. The double candlestick pattern is applicable to any...
Trading strategies and timeframes. However, when using the double-candlestick pattern, traders must manage risk carefully, as all trading involves a certain degree of risk.
9. Bullish Harami Pattern
A bullish engulfing pattern appears after a large bearish candlestick, followed by a small bullish candlestick whose body is completely contained within the body of the previous day's candlestick. This pattern may indicate a trend reversal to an uptrend. It's important to note that a bullish engulfing pattern does not always guarantee a trend reversal and should be analyzed in conjunction with other market indicators.
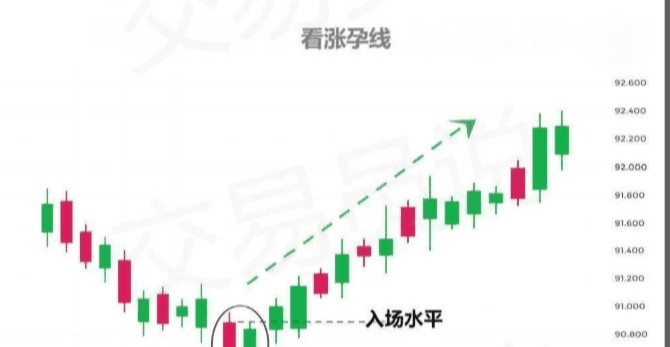
Traders should also be aware of potential false breakouts, where the price breaks out of the range established by the first and second candlesticks but then returns to the range.
10. Bearish Harami Pattern
The bearish harami pattern is the opposite of the bullish harami pattern. It appears after a large bullish candlestick, followed by a small bearish candlestick whose body is completely contained within the body of the previous day's candlestick. This pattern suggests a potential trend reversal to a downtrend. Traders should closely monitor potential bearish harami patterns and act accordingly. It's important to note that the bearish harami pattern may be invalid; it doesn't always indicate a trend reversal. Therefore, traders should exercise caution when trading this pattern.
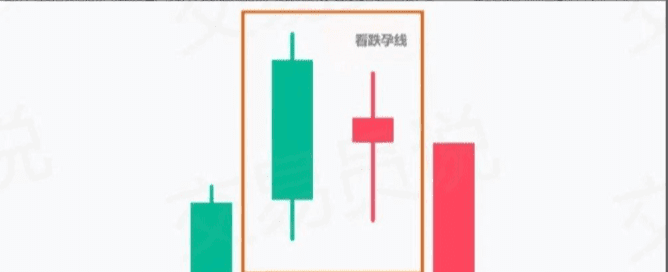
In addition, other indicators such as volume, moving averages, and oscillators should be used to confirm a reversal. By integrating these factors, traders can better evaluate trading strategies and increase the probability of success. A bearish engulfing pattern is generally considered a reliable signal that prices may fall.
11. Piercing Line Pattern
The piercing line pattern appears after a bearish candlestick, followed by a bullish candlestick. The opening price of this bullish candlestick is lower than the previous one.
A day's lowest price, but a closing price higher than the previous day's midpoint, could indicate a potential trend reversal to an upward trend.
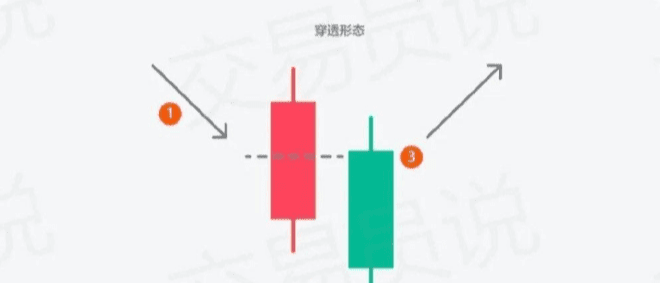
This pattern is often seen as a bullish signal, indicating buying pressure in the market and potentially the start of an uptrend. The piercing line pattern typically appears at the bottom of a downtrend, suggesting that buyers have taken control of the market and are driving prices back up. However, it's important to note that this may only represent a short-term trend, not a major reversal.
After a piercing line pattern appears, traders should observe higher highs to confirm the formation of a new uptrend. This can be done by looking at the previous day's low.
Set a stop-loss order to prevent losses if the pattern does not develop as expected. After confirming the pattern's appearance and increased buying pressure in the market, a long position with a tight stop-loss can be taken.
12. Dark Cloud Cover Pattern
The Dark Cloud Cover pattern is the opposite of the Piercing Line pattern. When a bullish candlestick is followed by a bearish candlestick, the bearish candlestick's opening price is higher than the previous day's high, but its closing price is lower than the previous day's midpoint, the Dark Cloud Cover pattern is formed.
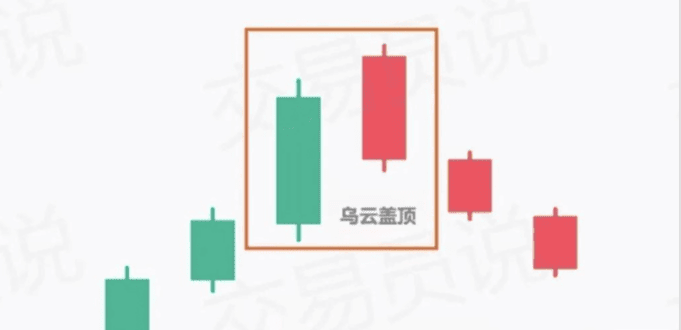
This could indicate a potential trend reversal into a downtrend. In this situation, traders should pay attention to changes in market sentiment and take appropriate action.
Movement. The Dark Cloud Cover pattern is considered more reliable when it has occurred after a prolonged uptrend or when it appears at a resistance level, as it indicates increased selling pressure.
Traders can combine the Dark Cloud Cover pattern with other indicators, such as support and resistance levels, oscillators, or moving averages, to confirm potential trend reversals. It's important to note that the Dark Cloud Cover pattern alone is insufficient for making trading decisions; it should be used in conjunction with other market analysis tools.
13. Morning Star Formation
The Morning Star pattern is a bullish pattern formed when a long bearish candlestick is followed by a small-bodied candlestick that gaps down, and then a candlestick that gaps up.
A long bullish candlestick pattern may indicate a potential trend reversal to an upward trend. A long bearish candlestick reflects short-selling activity, while a small-bodied candlestick is seen as a signal that selling pressure has paused.
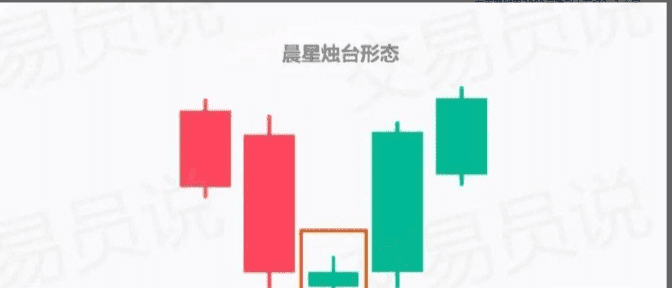
Finally, the long bullish candlestick indicates increased buying pressure, suggesting that the bulls have taken control of the market. Traders should confirm this by monitoring trading volume and relevant technical indicators.
The morning star pattern is a reversal signal. If it appears in an uptrend, it may indicate a trend reversal to a downtrend; conversely, if it appears in a downtrend, it may be interpreted as a signal of an upward reversal.
14. Evening Star Formation
The Evening Star, the opposite of the Morning Star, is a bearish pattern. It forms when a long bullish candlestick is followed by a small-bodied candlestick that gaps up, and then a long bearish candlestick that gaps down. This pattern may indicate a trend reversal to a downtrend. Traders should note that the Evening Star pattern is only meaningful when it appears at the top of the market, not at the bottom.
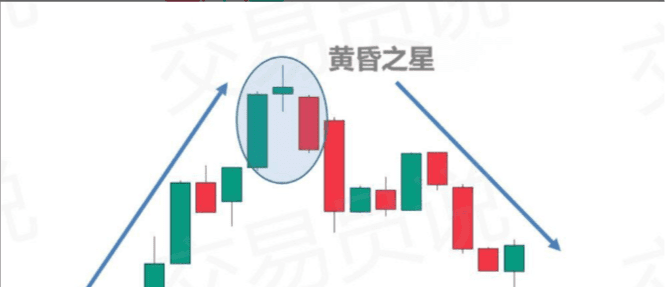
If prices fall after the Evening Star pattern, it may indicate a bearish trend; conversely, if prices continue to rise after the Evening Star pattern, it may indicate a bearish trend.
This indicates a continuation of the bullish trend. Traders should be cautious when trading the Evening Star pattern, as false signals may occur if the price reversal is not confirmed. In addition, traders should remember that a single indicator or signal cannot accurately predict future price movements.
15. Tweezer Bottoms
The "double bottom" pattern appears when two or more candlesticks have the same lowest price, indicating that buyers are entering the market at that level. This pattern suggests...
The trend may reverse into an uptrend. The tweezers bottom pattern can be used to identify potential entry points for long positions. Before trading, traders should look for confirmation signals from other technical indicators.
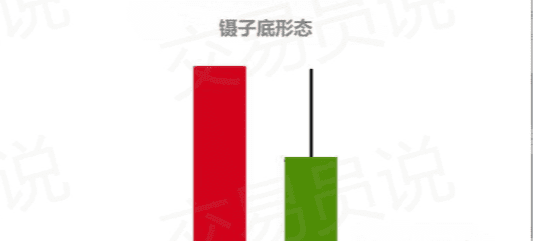
In addition, traders should set stop-loss orders at the lowest price of the tweezers bottom candlestick to prevent the trade from going as expected. Although the tweezers bottom is a potential signal of a trend reversal, it should be noted that it is not always reliable and must be used in conjunction with other technical indicators.
As with any trading strategy, traders should employ risk management techniques to protect their capital. Furthermore, traders can use the tweezers bottom pattern for both short and long positions. For example, if the market is in a downtrend, using the tweezers bottom pattern for short positions can be used to capitalize on the existing trend.
16. Tweezer Tops
The Tweezers Top pattern is the opposite of the Tweezers Bottom pattern. It appears when two or more candlesticks have the same highest price, indicating that sellers are entering the market at that level. This pattern may suggest a potential trend reversal to a downtrend. Traders should observe whether a bearish candlestick forms after the Tweezers Top to confirm the potential trend reversal.
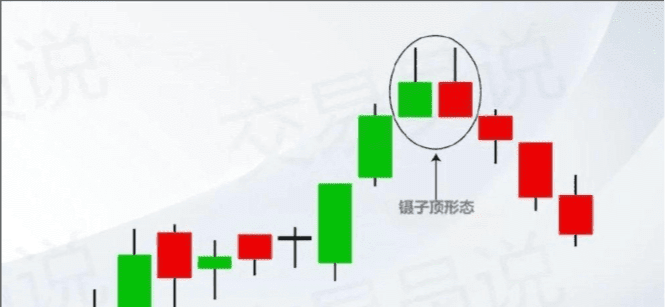
Once a bearish candlestick pattern is identified, traders should enter a short position at the market open and place a stop-loss order slightly above the top of the tweezers. (Monitoring)
Trading volume is also important, as an increase in trading volume usually indicates a stronger trend reversal.
The tweezers top pattern can also indicate a potential resistance level. If the market reverses multiple times at the same level, it can be considered a strong resistance area.
This could become a "ceiling" for further price increases. In this situation, traders should observe bearish candlestick patterns and prepare to enter short positions if the resistance level is not broken.
Triple Candlestick Patterns
The three-candlestick pattern is a technical analysis method used to identify the formation or reversal signal of a price trend. When three consecutive candlesticks form...
When the highs and lows gradually rise or fall, a three-candle pattern can be identified. Depending on the pattern type, this may indicate that the underlying trend is reversing or continuing.
This analysis is based on the assumption that prices follow a predictable pattern and can be used to predict price movements. However, like all technical analysis methods, it must be subject to certain limitations.
Actions should only be taken after confirmation with other indicators. The three-candlestick pattern is an effective tool to help traders capture emerging trends or signals in the market.
17. Three White Seldiers
The Three White Soldiers is a bullish pattern formed when three consecutive bullish candlesticks have progressively higher opening and closing prices. This pattern indicates strong upward momentum.
A strong upward trend. This pattern is often used to indicate that the market has ended a downtrend and may be turning upward.
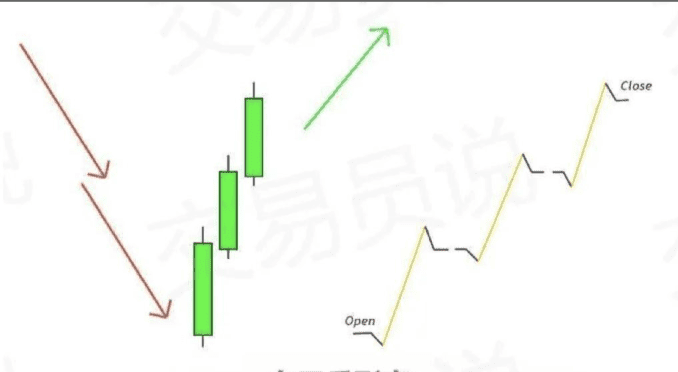
For the Three White Soldiers pattern to form, the opening prices of all three candlesticks must be within the body of the previous candlestick, showing gradually increasing upward momentum, and the closing price of each candlestick should be higher than the opening price of the previous candlestick.
18. Three Black Crews Form
The Three Black Crows pattern, the opposite of the Three White Soldiers pattern, is a bearish formation that occurs when three consecutive bearish candlesticks have progressively lower opening and closing prices. This pattern indicates a strong downtrend and suggests that market participants expect prices to continue their current trend.
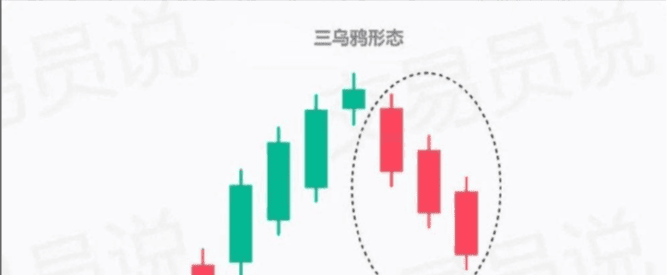
The Three Black Crows pattern is particularly powerful when it appears after a significant uptrend or a prolonged period of consolidation. As with all technical analysis tools, traders should combine it with other indicators to confirm any bearish signals.
19. Rising Three Methods
The Rising Three Methods is a bullish continuation pattern. It occurs when a long bullish candlestick is followed by three small bearish candlesticks, all of which contain...
This pattern forms when the first bullish candlestick is followed by another long bullish candlestick within the range of the first bullish candlestick. This pattern indicates a continuation of the upward trend.
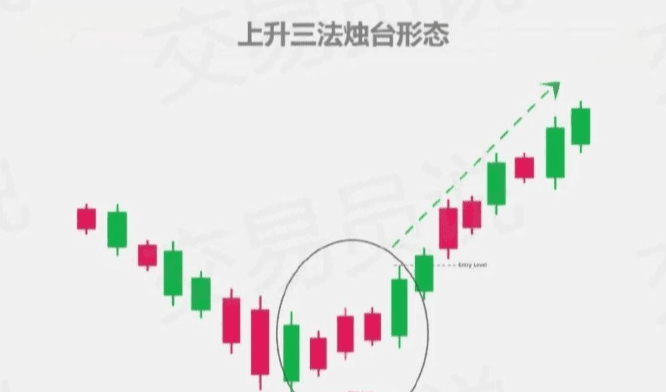
The Three Methods pattern, also known as the "Three Methods Reversal Pattern," is a strong reversal signal. When the closing price of the third candlestick is higher than the high of the first candlestick, traders should enter a long position. It's important to note that when trading this pattern, further confirmation of the signal may be necessary before taking action.
20. Falling Three Methods
The Three Falling Methods pattern, the opposite of the Three Rising Methods, is a bearish continuation pattern. It forms when a long bearish candlestick is followed by three small bullish candlesticks, all within the range of the first bearish candlestick, and finally, another long bearish candlestick appears. This pattern indicates a continuation of the downtrend. When the price breaks below the range of the third candlestick and falls below its low, traders should look for bearish signals to establish short positions.
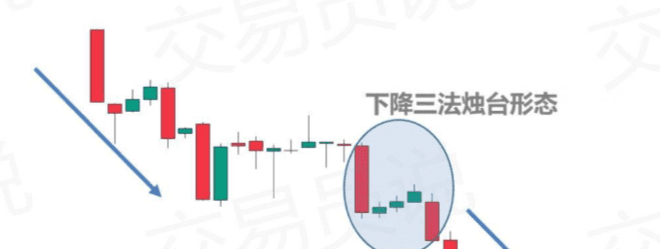
To prevent a price reversal, a stop-loss order can be placed above the high of the third candlestick. The Three Falling Methods pattern is considered a relatively reliable continuation pattern.
1. However, it should be noted that this pattern may fail in a strong uptrend, so caution is advised when trading.
21. Observe the shape of the bullish pennant.
The bullish pennant pattern resembles the bullish flag pattern, but its shape is a triangle rather than a rectangle. It appears after a sharp upward trend followed by a short-term consolidation.
When a symmetrical triangle is formed, it may indicate a continuation of the upward trend. Traders should pay attention to signals that break through the upper trendline of the triangle, and establish long positions after confirmation.
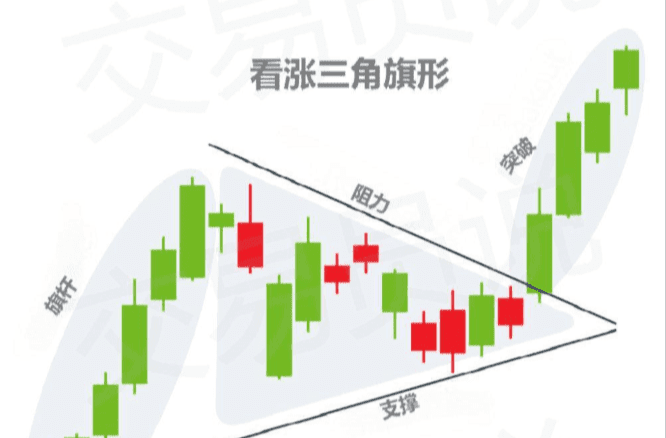
After a breakout, a stop-loss order should be placed at the trendline below the flag to prevent further losses. The target price can be calculated by adding the height of the triangle to the breakout point. The target price is typically reached approximately three weeks after the breakout.
Capitalizing on upward market trends through bullish pennant patterns can be a profitable strategy. However, when trading any pattern, it's crucial to remember that past performance doesn't guarantee future results, and always manage risk prudently.
22. Bearish Pennant Pattern
The bearish pennant pattern is the opposite of the bullish pennant pattern. When a short-term consolidation period occurs after a sharp downtrend and a symmetrical triangle is formed, it may indicate a continuation of the downtrend.
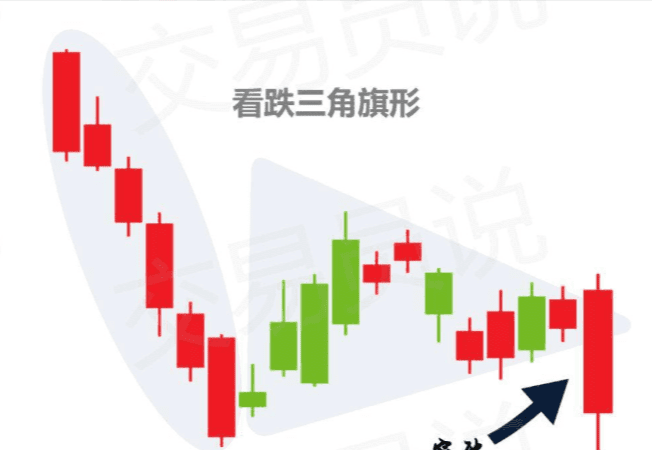
A bearish pennant pattern typically appears in a downtrend and is a signal that prices may fall further. After the initial sharp drop, the bears...
The market gains dominance, pushing prices further down until buying pressure offsets selling pressure. This triggers a brief price pause, forming a flag pattern.
23. Bullish Three Inside Up Pattern
The Three Inside Rising pattern appears after a long bearish candlestick, followed by a small bullish candlestick that is completely contained within the body of the previous day's candlestick, and finally a long bullish candlestick with a closing price higher than the previous day's high. This pattern may indicate that the trend may reverse into an upward trend.
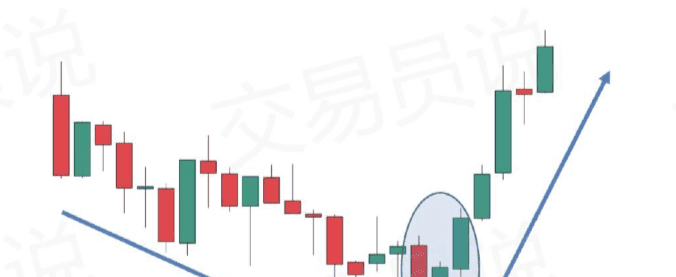
This pattern should be used in conjunction with other technical indicators to confirm the trend direction. When trading this pattern, traders should also consider fundamental analysis and risk management principles.
Steps for the three-day upward trend pattern in trading:
1. Identify this pattern on the chart. This pattern typically appears after a long-term downtrend and may indicate that bulls are entering the market.
2. Look for confirmation signals from other technical indicators, such as moving average crossovers or breakouts of resistance levels.
3. Place a buy order at the breakout point of the pattern's highest point and set a stop-loss order below the lowest point. If executed properly, this strategy can be profitable in a market with strong bullish momentum.
24. Bearish Three Inside Down Pattern
The Three Inside Down pattern is the opposite of the Three Inside Up pattern. It appears after a long bullish candlestick, followed by a small bearish candlestick that is completely contained within the body of the previous day's candlestick, and then a long bearish candlestick with a closing price lower than the previous day's low. This pattern may indicate that the trend may reverse into a downtrend.
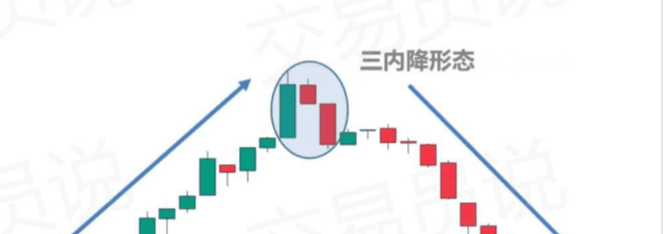
Traders often pay attention to this pattern to aid their decision-making. When encountering this pattern, they should recognize its bearish implications and consider establishing a short position. However, it's important to note that the three consecutive downtrends pattern does not guarantee a price drop; it only indicates a possible reversal and increases the likelihood of further declines.
Continuation Patterns
Continuation patterns are technical analysis tools used to determine the future direction of the market. They are based on observing price behavior over a period of time and using this data to predict whether a trend will continue or reverse.
Continuation patterns can be used to determine entry points for buying or selling and provide an indication of the strength of the current trend, thus helping traders to judge the trend.
The potential duration of these patterns. By analyzing continuation patterns, traders can anticipate market trends and make better trading decisions.
25. Observe the Bullish Flag Pattern.
The bullish flag pattern is a holding pattern that appears after a sharp upward trend, followed by a short period of consolidation, forming a flag shape. This pattern may indicate a continuation of the uptrend. The formation of this pattern involves: a rapid price increase, a brief period of sideways movement for several days or weeks, followed by a resumption of upward momentum.
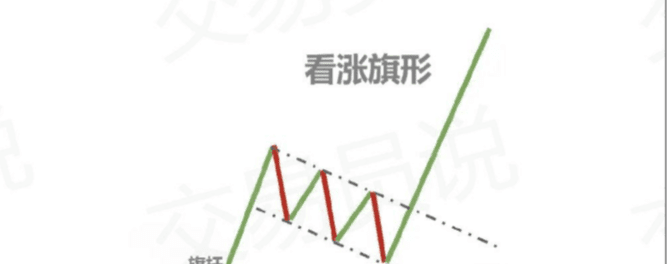
The flag pattern should form between two parallel trend lines, with the lower trend line having an angle exceeding 45 degrees. A break of the upper trend line could indicate a resumption of the uptrend.
Traders should pay attention to confirmation of trading volume to ensure the breakout is valid. When trading a bullish flag pattern, stop-loss orders should be placed below the lower trendline to prevent losses from unexpected price fluctuations. When the price reaches or exceeds the upper trendline of the flag, consider taking profits to maximize returns on successful trades.
26. Bearish Flag Pattern
The bearish flag pattern is the opposite of the bullish flag pattern. It appears after a sharp downtrend, during a short period of consolidation, and when a flag pattern forms.
This could indicate a continuation of the downtrend. After the flag pattern forms, traders may establish short positions in anticipation of further price declines.
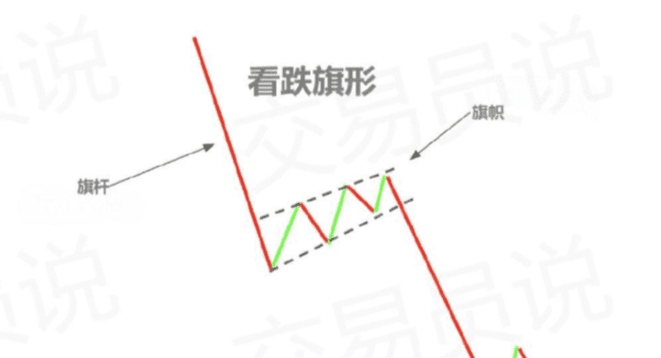
As with all chart patterns, it is important to wait for confirmation signals before making any trades. Traders should also pay close attention to volume and momentum to confirm whether a trend has reversed or continued.
27. Watch Zhang Zhixing (Bullish Rectangle)
A rectangular pattern is a continuation pattern that appears when prices consolidate between two parallel horizontal trend lines. This pattern may indicate an upward trend.
For a trend to continue, the rectangle pattern should contain at least two highs and two lows, with market prices fluctuating between the trend lines.
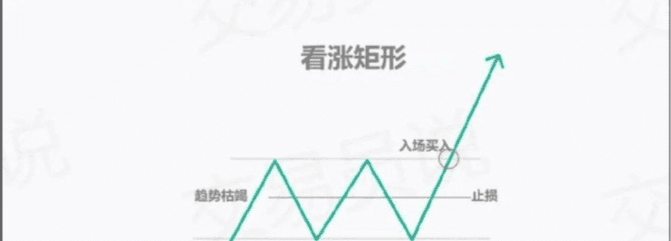
Bullish rectangles are often seen as a sign of market uncertainty, indicating a relative balance between buying and selling forces. When prices break out of this pattern, it usually suggests increased trader activity, but the direction typically aligns with the previous trend. Once a breakout occurs, watch for a continuation of the uptrend and consider establishing long positions.
28. Bearish Rectangle
A bearish short pattern is the opposite of a bullish short pattern. It forms when the price consolidates between two parallel horizontal trend lines and may indicate a continuation of the downtrend. A break below the lower trend line confirms a bearish short pattern, which could lead to further price declines.
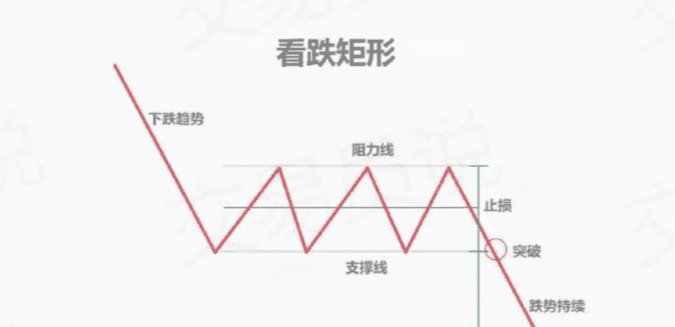
Traders should pay attention to this pattern to identify entry and exit points. Before entering a long position, close monitoring for price reversals is essential.
Signal: If the price breaks upward from a rectangle pattern, it may indicate that the downtrend has reversed and a new uptrend has begun. By carefully monitoring rectangle patterns, traders can better prepare entry points and potential reversal signals.
29. Observe the shape of the cup and handle (Bully Cup and Handle)
The bullish cup and handle pattern is a continuation pattern that appears when prices go through a U-shaped consolidation period, followed by a smaller consolidation period that forms the "handle." This pattern may indicate a continuation of the uptrend.
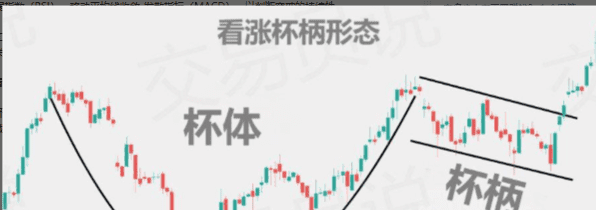
When the price breaks through the handle and continues to rise, a key indicator to confirm the validity of the breakout is trading volume. If the breakout is accompanied by significant volume...
Trading volume may indicate further upward momentum. In addition to volume, traders should also combine other technical indicators, such as the Relative Strength Index (RSI) and the Moving Average Convergence Divergence (MACD), to determine the sustainability of the breakout.
These tools can help traders determine whether the forces behind a price movement are strong enough or merely a temporary phenomenon. Furthermore, trading...
Investors should pay attention to potential reversal patterns, as these could indicate a potential price pullback.
30. Bearish Cup and Handle Pattern
The bearish cup and handle pattern is the opposite of the bullish cup and handle pattern. It appears when the price goes through an inverted U-shaped consolidation period, followed by a smaller consolidation period that forms the "handle." This pattern may indicate a continuation of the downtrend.
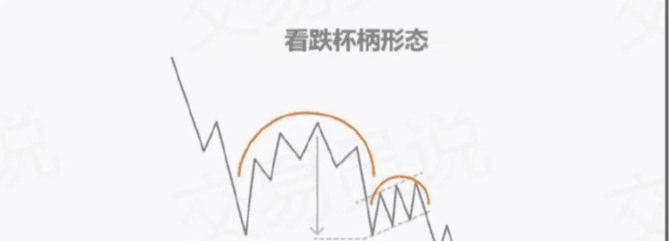
Similar to the bullish cup and handle pattern, traders need to pay attention to whether the price breaks through the resistance level formed by the handle to confirm a trend reversal. If the breakout fails to lead to further gains, it may mean that the bearish trend will continue. When trading this pattern, it is necessary to take into account factors such as trading volume and price before entering a trade.
In addition, traders should set stop-loss orders at reasonable levels to manage risk. By taking these precautions, traders can more effectively utilize the bearish cup and handle pattern as a trading strategy.
The bearish cup and handle pattern can be used to identify short-term trends or potential market reversals, making it a flexible trading technique that traders should...
Pay close attention to trading volume during the cup and handle formation; if volume gradually decreases as prices form lower highs, this could indicate an impending reversal.
31. Look at the model (Bullish Wedge)
A wedge pattern is a continuation pattern that appears when prices consolidate between two upward-sloping converging trend lines. This pattern may indicate a continuation of an uptrend.
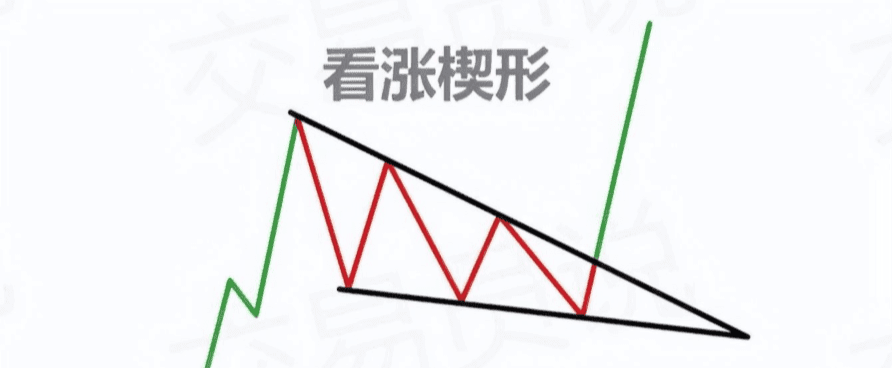
This pattern is generally considered a strong price signal. When the price breaks through the upper trendline, it indicates that the current uptrend will continue; when the price falls below the lower trendline, it suggests a possible reversal and a shift to bearish sentiment. Typically, trading volume decreases during the wedge formation period, and increases again after a breakout or breakdown.
Increased activity in this area can provide confirmation of the trend and strengthen confidence in its direction; however, traders should be aware of bullish wedges.
It is not always reliable; sometimes false breakouts or breakdowns may occur. Exercise caution when trading and make decisions only after confirming with other technical indicators.
32. Bearish Wedge
A bearish wedge is the opposite of a bullish wedge. It appears when the price consolidates between two downward-sloping converging trend lines, and this pattern may indicate a continuation of the downtrend.
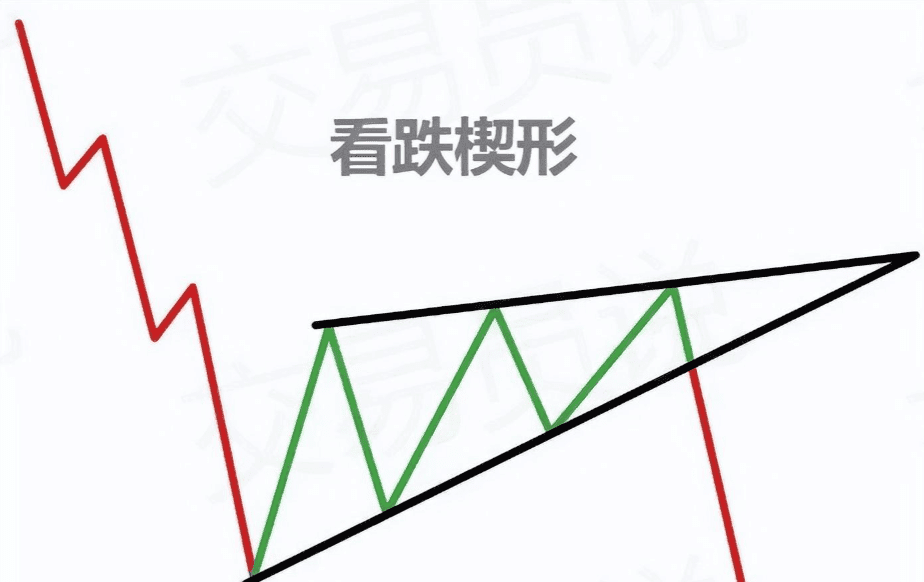
When price action narrows and approaches the apex of a wedge, traders should expect a breakout, either upwards or downwards. In most cases, a bearish pattern indicates further price declines. This is typically because the pattern signifies weakening market momentum as short-selling investors become more cautious.
33. Observe the rounded bottom.
A bullish rounded bottom is a reversal pattern that forms after a long downtrend, during a U-shaped consolidation period. This pattern may indicate a reversal of the downtrend.
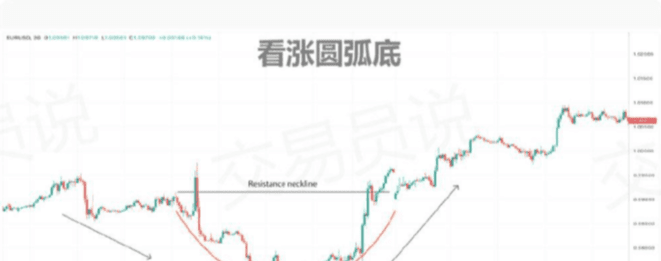
This pattern consists of two distinct lows, one lower than the other, followed by a price rise that breaks through the previous resistance level; this breakout can be considered a buy signal. The formation time of this pattern varies depending on market conditions and can last from weeks to months. Increased volume during the consolidation period may indicate increased buying activity.
Combining other indicators and market conditions can help traders determine whether to enter a trade. This allows traders to capitalize on potential profit opportunities in the market, regardless of whether it is rising or falling.
A bullish rounded bottom can also indicate a reversal of a downtrend in stocks. When prices fall to new lows and then rebound to form a rounded bottom, it usually indicates that sellers have run out of steam and buyers have begun to step in, pushing prices up.
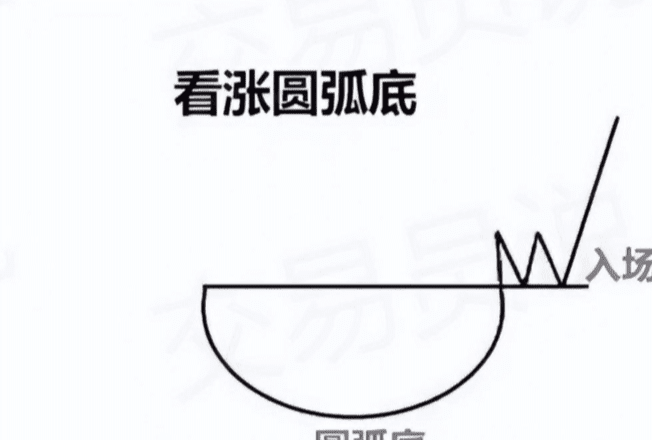
When analyzing potential trades based on the rounded bottom pattern, traders should also consider the overall market environment. If the market is trending downwards, establishing a long position solely based on the rounded bottom pattern may be risky. As with all technical analysis, fundamental factors must be considered before trading.
In summary, the rounding bottom pattern is a useful tool for traders to identify potential buy and sell signals in the market. By combining technical and fundamental factors, traders can better determine whether a rounding bottom is forming and incorporate it into their trading strategies. With the right knowledge, the rounding bottom pattern can boost a trader's win rate.
34. Bearish Rounding Top
A bearish rounding top is a chart pattern that indicates a downward trend in prices. It forms when a price trend presents a series of lower lows, a slight rebound occurs, and then the price falls back to lower levels.
This pattern suggests strong selling pressure in the market and indicates that prices may continue to fall in the near term. To identify a bearish rounded top, traders need to look for a rounded top that contains two distinct lows and two distinct highs.
The overall trend should be downward, but prices should exhibit some degree of volatility. Furthermore, trading volume should show an increasing trend during this period. Combining these factors can provide important insights into the future price of the underlying asset.
Therefore, traders need to closely monitor trading volume and price movements in the stock market or other markets to correctly identify a bearish rounding top. If this pattern is correctly identified, it can provide traders with shorting opportunities or protect existing strategies from potential losses.
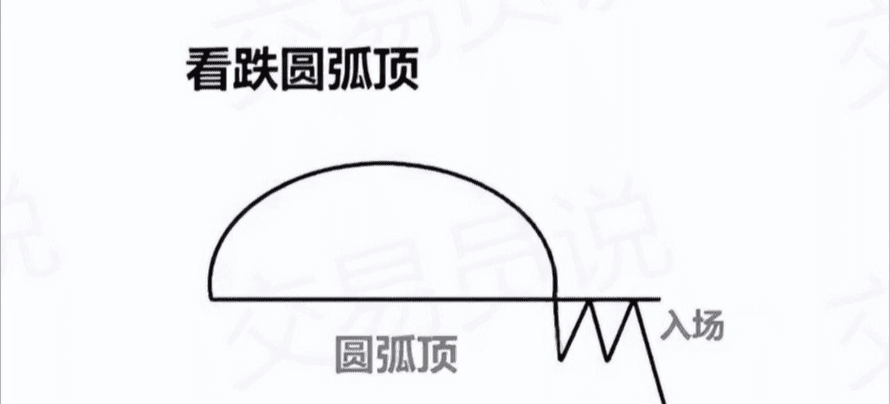
However, traders should also be aware that bearish patterns are not always reliable and false signals may occur. Therefore, traders should always implement appropriate risk management when trading these patterns.
Furthermore, traders need to understand the different types of rounding tops in order to correctly identify them in the market. By understanding the formation process of bearish patterns, traders can better prepare for potential entry and exit points.
Summarize
We have now discussed all 34 candlestick patterns in the market. It's important to remember that these patterns should be considered in conjunction with other technical analysis methods.
Tools should be used in combination, rather than relying solely on them, to make trading decisions, thus increasing the chances of making profits.
In summary, learning how to interpret and understand candlestick patterns is an essential skill for traders and investors. By understanding this...
By learning to identify candlestick patterns and combine them with other technical analysis tools, traders can improve their ability to identify potential opportunities in the market.
Finally, to survive in the cryptocurrency market, especially for those with smaller capital, it's crucial to avoid pitfalls, capitalize on major upward trends, and manage risk. The following are some of the most widely accepted methods.
These proven, practical rules are all insightful and serve as a wake-up call:
Don't fantasize about doubling your money every day. For small capital, the best strategy is to catch one major upward trend each year. If you go all in, one wrong move and your account is wiped out. Truly successful people understand that "survival" is more important than "winning one bet."
The first step when entering the market is not to invest money, but to practice. You can lose hundreds of times in a demo account without feeling bad. Once you get wiped out in a real account, you're out. Practice your judgment before you sit down at the table. Don't treat your principal as tuition.
Hearing good news? Don't get excited; others have already positioned themselves before you. A gap-up opening is often not an opportunity but a trap. Especially when the price surges on the day the good news is released or the following day, smart people choose to exit decisively.
In the week leading up to a holiday, only the most skilled traders manage to exit unscathed. Historical experience tells us that most major players reap the rewards before the holiday, while newcomers are always wiped out during the holiday. There is only one way to safely get through the holiday: clear out your positions before the holiday.
When investing for the medium to long term, remember to keep 30% cash on hand. Sell some when the price goes up, and buy back when it drops sharply. Repeat this process of swing trading to gradually grow your small capital. Don't aim for quick riches, just aim for steady growth.
For short-term trading, only focus on actively traded coins. Don't even bother looking at coins with plummeting trading volume or price movements resembling an electrocardiogram. Volatility is the breeding ground for profits; coins without volatility are only good for sleeping, not for trading.
The real opportunities often lie hidden after a market crash. The sharper the drop, the stronger the rebound. The key is to avoid reckless rushes. Use the 15-minute KDJ indicator to identify turning points. Don't act too early or be greedy; just earn what you're meant to earn.
The most important rule: admit your mistakes. Cut your losses decisively when the price breaks down; don't fight the market head-on. You might survive one loss, but not ten. One wipeout can make recovering your losses a distant dream. Your principal is your only capital to turn things around.
My final words to everyone who takes trading seriously: Don't try to learn a hundred techniques. To truly succeed, you only need to master one or two. Candlestick charts + volume? That's enough to make you invincible in the market. Specialization is key; dabbling will only leave you a half-baked expert who gets burned. Welcome to follow "One Word" (一言) for live trading, learning, and discussions. You'll gain a clear understanding of market direction and strategies. Knowing the market's style in advance gives you time to better manage it!
The team still has positions to quickly get on board $BTC $ETH