


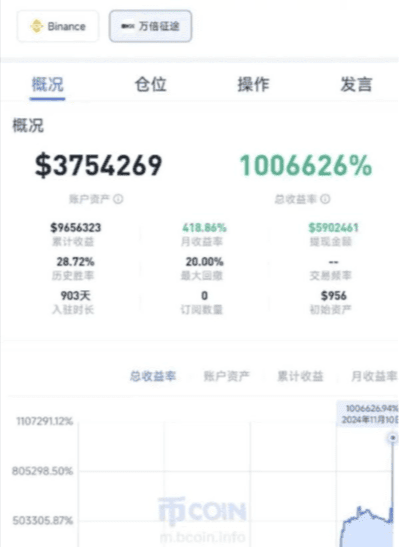
After struggling in the cryptocurrency space for ten years, it wasn't until six years ago, under the careful guidance of a senior, that I suddenly realized and found a trading strategy that suited my own characteristics. Nowadays, although I have not made it into the ranks of the wealthy, I have achieved sustained profitability, enough for me to comfortably sit in the top 20% of the investment world.
Years ago, I deeply realized that an excellent trading strategy is an indispensable tool for investors. Without systematic guidance, it is like a blind person touching an elephant, with little chance of success. However, extracting an effective trading strategy is by no means an easy task.
The effectiveness of this strategy lies precisely in its counterintuitive nature. It requires us to abandon greed and fear, to be calm and decisive, to reject personal assumptions, and to steadfastly implement the established policy.
Having navigated the cryptocurrency world for ten years, it wasn't until six years ago, with the careful guidance of a senior figure, that I finally understood and found my path.
My own unique trading strategy. While I haven't yet joined the ranks of the wealthy, I've achieved consistent profitability, enough to secure my place in the investment world.
The top 20% tier.
Years ago, I deeply realized that a superior trading strategy is an indispensable tool for investors. However, without systematic guidance...
Capital investment is like the blind men and the elephant—the odds of success are slim. However, developing a truly effective trading strategy is by no means easy.
The effectiveness of this strategy lies precisely in its counterintuitive nature. It requires us to abandon greed and fear, to be calm and decisive, to reject personal assumptions, and to steadfastly implement the established policy.
Many traders believe they lose money because their skills aren't good enough, they don't have enough information, and they missed the right timing. But frankly, these are just superficial reasons. The real reason is simple—you're doing too much.
You might disagree, thinking, "I studied so many technical indicators, I watched the market every day, I was more diligent than others, so how could I be wrong?" But the more you think like that, the easier it is to fall into the biggest trap in trading: frequent trading, which will exhaust you.
1. You think you're controlling the market, but you're actually just increasing the number of mistakes you make.
The essence of trading is making judgments. And every judgment is, in fact, a gamble. Your belief that it will rise is based on your interpretation of market conditions, logic, and news. But here's the problem—you're not a god, and your judgments will inevitably be wrong sometimes.
Each transaction is actually an independent event.
You might be right today, but you might not be right again tomorrow; you might win three times in a row, but that doesn't mean you won't lose the fourth time. Unfortunately, many people don't think this way. The more they win, the more they feel like they're on a winning streak, so they trade more and more frequently, and the more frequent they are, the more out of control they become.
For example, even if you have an 80% win rate, which is already amazing, what is the probability of you getting it right 10 times in a day? Only about 10%.
You think you're "improving efficiency," but you're actually just constantly exposing yourself to the possibility of making mistakes.
Second, people get tired, and the brain can make mistakes in its judgment.
Many people don't trust others, so they always want to rely on their own judgment. That's fine; this kind of independent thinking is a good thing. But you must understand that your cognitive abilities are limited, and your emotional state can affect your judgment.
No matter how calm you are, you'll have moments of anxiety; no matter how experienced you are, you'll sometimes follow the crowd.
Even the logic you believe in most can suddenly become invalid due to market sentiment, breaking news, or policy disturbances.
So when you operate frequently, you are not actually "improving your hit rate", you are accumulating the number of judgment errors.
At first you can remain rational, but after a dozen or so trades, your brain will be swayed by emotions.
A true master is not someone whose judgments are always correct, but someone who knows when to stop.
III. How do expert players play? Do fewer things correctly, and do more things correctly and heavily.
Look at Buffett; he's bought several large companies over the decades and basically hasn't touched them.
Look at Duan Yongping. After buying Moutai and Apple, he just held onto them, not even bothering to check the stock prices. Why?
They're not lazy; they know that the logic of making money isn't about "doing more," but about "doing it accurately."
Duan Yongping once said, "I haven't made any trades for many years because the price hasn't reached what I want."
Ordinary people might find this absurd, thinking, "If you don't trade, how will you make money?" But those who truly understand the industry know that he has actually been "trading" all along—he is waiting, watching, and accumulating the energy for a fatal blow.
Their deals are like those of a sniper: they don't spray bullets, but wait for an opportunity, then fire a single shot to solve the problem.
Fourth, what you're doing isn't trading, it's comforting yourself.
Many people feel anxious if they don't place an order for a day, and they always want to click the mouse, look at the candlestick chart, or buy something.
Are you really operating it? No, you're just looking for a sense of security.
If you haven't bought anything in your account, you feel like you've "missed out"; if others make money, you get even more anxious and can't wait to jump in; once you lose a little, you think, "I'll make it back with the next investment."
You're not trading; you're comforting yourself. You're trying to alleviate your inner emptiness by constantly "doing something."
But investing is not an outlet for emotions; it is a rational game.
Truly experienced people would rather wait six months without taking any action than act rashly just to relieve anxiety.
Fifth, opportunities are waited for.
You might ask, how can you make money without trading? But real opportunities to make money don't come every day.
If you trade ten times a day, you might only make a small profit each time.
But if you spot an opportunity, dare to invest heavily, and hold it for six months, that one trade can be enough to sustain you for three years.
That's the key: not winning a little bit every time, but winning big a few times.
Buffett said, "You won't have more than 20 of the best opportunities in your life." In his entire life, he has only made a few truly significant investments, and each one was made with extreme certainty and determination.
Duan Yongping did the same. He set his sights on Apple, but instead of repeatedly short-term speculation, he invested a large sum of money all at once and then held it there.
Did you understand? Their operating logic has never been based on "frequency," but on "odds."
6. You think frequent trading is making money, but it actually drains your life force.
What I fear most is not losing money, but the feeling of "I've been working so hard, but I'm still losing money."
You look at the charts, do your homework, and trade dozens of times, but you get more and more tired, more and more anxious, and less and less confident.
The less money in the account, the worse the mood, the more hasty the actions, and the worse the outcome.
Trading becomes an emotional black hole, swallowing you up bit by bit. You are no longer the calm, analytical investor, but a button-operated robot dictated by market movements.
At this point, you are actually quite far removed from the identity of an "investor".
7. Trading is about doing less, doing it right, and doing it heavily, not about randomly trading every day.
It's not that you shouldn't trade, it's that you should wait, think it over, act less, and be more precise.
You've truly begun to learn how to trade when you stop placing orders out of anxiety, stop adding to your positions to try and recoup losses, and stop participating just for the sake of participating.
A mature investor's relationship with the market is one of restraint, choice, and waiting, rather than frantic activity, joining the crowd, or chasing highs and selling lows.
Remember this sentence for you:
A true master is not someone who makes the most trades, but someone who makes fewer mistakes and dares to make more correct ones.
I spent five years reviewing 400 charts every night, turning 11,000 into 18 million, all thanks to how to buy on complex pullbacks. My win rate was a staggering 100%, winning every single time.
Through my own practice, I've achieved a 100% win rate. I've compiled these tips over the past few days and am now sharing them with those who are interested. Let's learn and master them together; it's worth saving!
What is a complex pullback? Simply put, any pullback that forms a certain pattern is called a complex pullback. For example, look at the chart below. In an uptrend, a descending wedge pattern appears (Figure 1). We call this a complex pullback within that uptrend. Don't worry if you don't know what a wedge is; we'll explain that later. Now let's look at another example: In a downtrend, a ascending flag pattern appears. We call this ascending flag pattern a complex pullback within that downtrend (Figure 2).
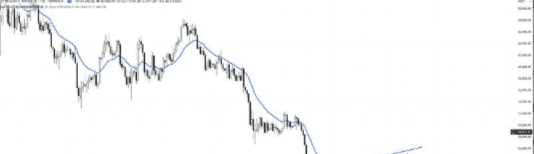
(Figure 1: Descending wedge)
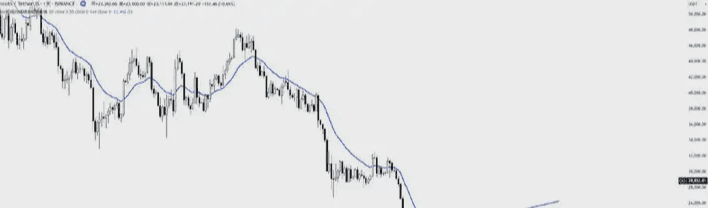
(Figure 2: Rising Flag)
Now look at this chart again. Can I consider this mass as a complex retracement? Yes or no? Please answer me, 3, 2, 1 (as shown in Figure 3). The answer is, of course, yes, because it formed a rectangle during the decline. At this point, you might say, "Hey coach, how can this ugly mass be called a rectangle?" Okay, no problem. Let's call this entire irregular shape a complex retracement of this decline. This is what we often refer to in our system classes as "fuzzy correctness." So you see, learning technical analysis isn't so difficult after all.
In conclusion, any pattern that emerges, even if it's irregular or incomprehensible, can be considered a complex pullback within the recent trend on the left. Of course, we've covered common patterns in our live lessons, such as wedges, rectangles, flags, and triangles. Due to time constraints, we'll focus on wedges in detail later; we'll discuss rectangles, flags, and triangles when we have more time.
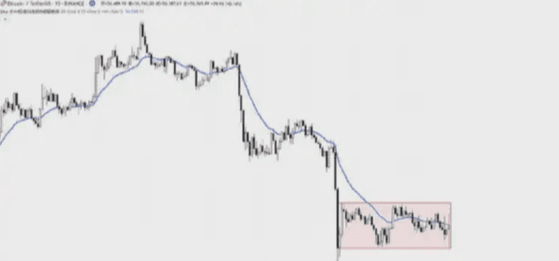
(Figure 3: Ugly and irregular shape)
How to buy during complex pullbacks?
2
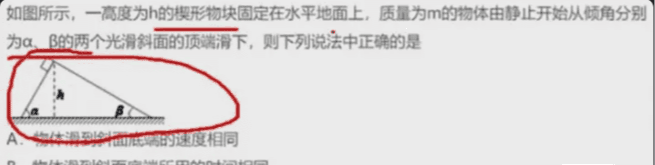
Since we're discussing wedges, let's first understand what a wedge is. Please note that this character is pronounced "xié" (楔), not "qī" (契). So, what is a wedge? We actually learned about it in junior high school physics. (See Figure 4) It possesses convergence and symmetry. After understanding wedges, let's look at these six common types found in the market. (See Figure 5)
(Figure 4)
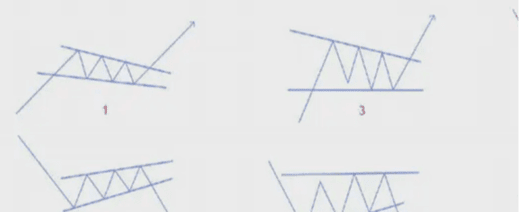
(Figure 5)
Let's talk about the first and second types first (as shown in Figure 6). Looking at diagram number 1, a descending wedge appears in an upward trend. So we will follow this upward trend to reverse this descending wedge.
So how do we identify the reversal pattern of a descending wedge? Essentially, we need to see if the wedge has completed its formation; in other words, we need to see if the wedge has reached its final stage.
So how do we determine if it has finished its run or reached its final stage? Our method is to count the driving forces of this wedge shape and use those forces to determine if a divergence has occurred in the wedge shape.
For example, taking diagram number 1 as an example, this represents the first, second, and third upward pushes. During these pushes, we can clearly see that although each push creates a lower high and a lower low, the distance between each push is getting shorter. At this point, we can say that this wedge pattern has shown divergence. If these conditions are met, it's highly likely a sign of weakening momentum, and we can say that this wedge pattern is nearing its end. If your trading style leans towards the left side, you can enter a long position as soon as the price reaches a high of 1. Place a T1 take-profit order at the starting point of the wedge, and a T2 take-profit order equidistant from the left-side continuation of the trend.
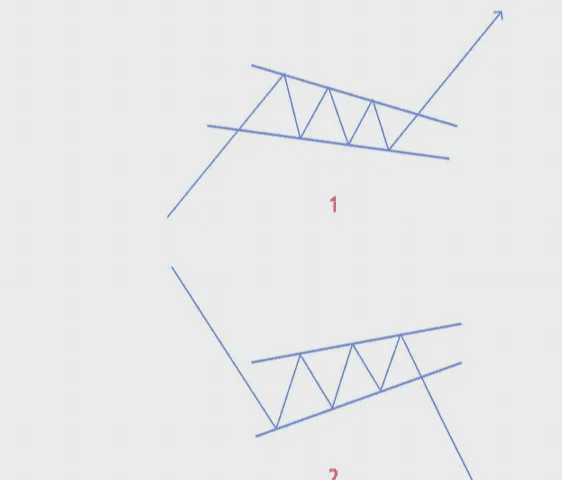
(Figure 6)
To better understand, let's look at a case study on the chart. (See Figure 7) This is the daily chart of Rock Sugar Orange. A descending wedge pattern appeared within a clear upward trend. Now, let's count the driving forces behind this descending wedge. One push, two pushes, three pushes—has this descending wedge shown any divergence? Is each push weaker than the last? The answer is yes, of course. Here, a high 1 appears, a modified bullish engulfing pattern consisting of three candlesticks. Therefore, we directly enter a long position at market price. The T1 take-profit is placed at the starting point of the descending wedge, and the T2 take-profit is placed at an equidistant point from the left-hand side of the trend. However, as we often say in our live classes, "water overflows when full, the moon wanes when full," so our take-profit was placed around this position. The subsequent market movement indeed successfully reached our take-profit level. This is the first common type of descending wedge reversal.
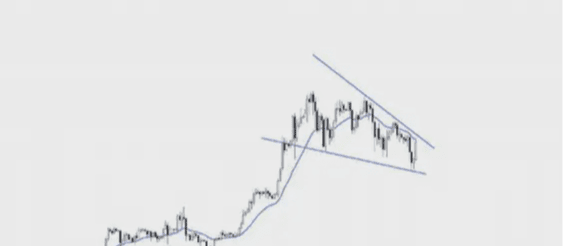
(Figure 7)
During a downtrend, does the same logic apply when encountering a rising wedge? Let's look at diagram number 2. A rising wedge appears within a downtrend. We then trade the reversal of this rising wedge in the direction of the downtrend. The only difference is that we're not going long, but rather shorting. I won't go into detail here; these are the two most common types of wedges. (See Figure 8)
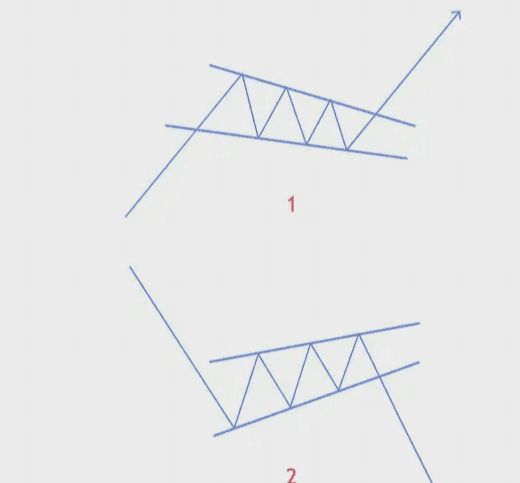
(Figure 8)
Next, let's look at a more special type of wedge shape, starting with diagram number 3. (See Figure 9)
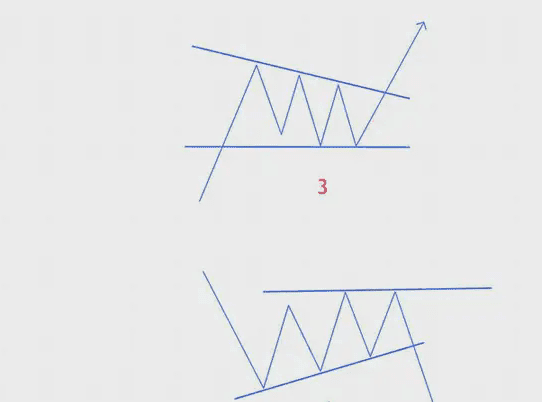
(Figure 9)
A descending wedge pattern appeared during an uptrend, but the final push of this descending wedge did not create a lower low; instead, it formed an SB structure together with the second push. If you don't know what an "SB structure" is, you can watch my free video series (From 0 to 1, Episode 91).
Similarly, let's look at a case study on the chart (Figure 10). This is a 5-minute chart of spot gold. In a clear uptrend, a descending wedge pattern appears. There's a first push, a second push, a third push, and the third push shows divergence. The first push is weaker than the first. The only difference is that the last push didn't create a lower low; instead, it formed an SB structure with the second push. Now, let's first find the first high, which is the bullish engulfing pattern formed by these two candlesticks. Then find the second high, which is this candlestick. Now, can we directly enter a long position at market price?
Don't forget what we just talked about: water overflows when it's full, and the moon wanes when it's full. We placed the T1 profit-taking order slightly below the starting point of the descending wedge, and the subsequent market movement indeed hit our profit-taking level smoothly. This is a rather special reversal of the descending wedge.
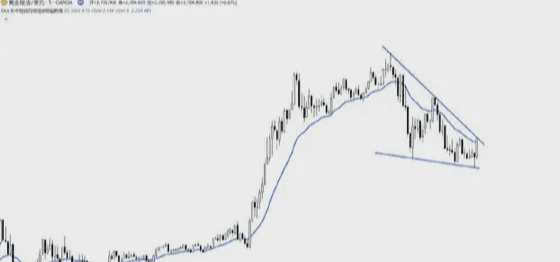
(Figure 10)
The same logic applies when encountering a rising wedge during a downtrend, except that going long is replaced by going short. I won't go into detail here either, as this is a rather special type of wedge.
To summarize the four wedge patterns we discussed above, they share a common characteristic: they all follow the larger trend on the left and move smaller against it. Follow the larger trend, move against the smaller one. Therefore, it's best to count the wedges during pullbacks, not during the main trend. We've explained this in great detail in our system course (Naked Candlestick Chart). I hope you develop this habit and avoid making the following mistake. (Figure 11)
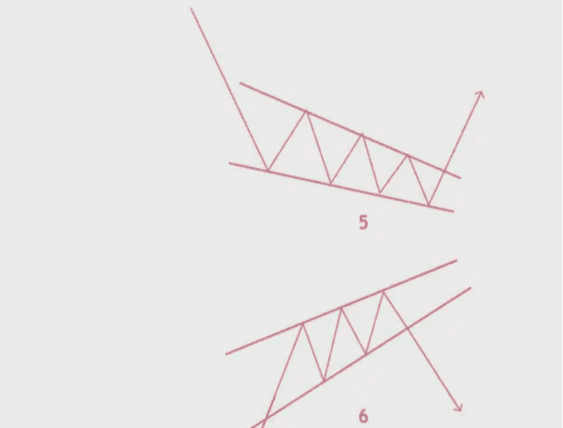
(Figure 11)
So why don't we avoid using trend reversals within the main trend—that is, why don't we look for rising wedges in an uptrend or falling wedges in a downtrend? There are two main reasons:
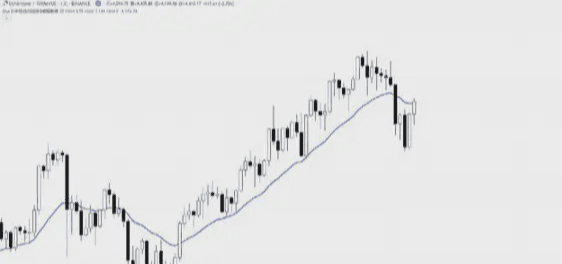
The first reason is that if you count pushes during a main trend, you might be able to count more than 3 pushes. If a market trend forms a channel, you might even count 4, 10, or 100 pushes (as shown in Figure 12). However, our purpose in counting pushes is not just to count pushes for the sake of counting pushes, but to see if there is any divergence in the entire wedge pattern. This is the first reason.
The second reason, and the most important one, is that if you're counting down within the main trend, you'll be tempted to try and reverse that trend. We've emphasized this many times: don't go against the major trend, don't go against the major trend, don't go against the major trend. So, don't count down within the main trend, don't count down within the main trend, don't count down within the main trend. This is extremely important, absolutely crucial.
The essence of trading is to follow the major trends and go against the minor ones. I hope you will keep this in mind.
(Figure 12)
In conclusion, here's how I bought in during complex pullbacks.
Step 1: Find the pattern. We've mentioned that there are many patterns, such as flags, wedges, triangles, rectangles, and so on. Today, we'll just use wedges as an example. In an uptrend, find a descending wedge, or in a downtrend, find a ascending wedge.
The second step is to use numerical pushes to see if the wedge pattern has been completed and if a divergence has occurred.
Step 3: Find the entry signal, that is, the high 1 or SB structure entry.
Technology is essential for survival; teaching someone to fish is worse than giving them a fish; the true allure of investing lies in leveraging small investments for potentially large returns; and securing profits you're confident in is the foundation of financial management! Remember to bookmark and follow!
Continuously sharing valuable insights into the cryptocurrency world, let's explore its mysteries together. $BTC $ETH