

300U Principal Optimal Contract Strategy (Efficient Flip Plan)
Core Principle: Strictly separate accounts | Only trade BTC+
/ETH+
|Stop Loss>Take Profit|Limit 3 times
1. Starting Phase: 300U→1100U (3 Level Sprint)
Strategy: 100U×3 times, each with 10x leverage, 7% Take Profit/5% Stop Loss (Profit-Loss Ratio 1.4:1)
Execution Steps: Level 1 (100U→200U) Goal: Profit 70U (7% Take Profit) Stop Loss: -50U (5%) Success → Enter Level 2, Failure → Remaining 200U Adjust Strategy
Level 2 (200U→400U) Goal: Profit 140U Stop Loss: -100U Success → Level 3, Failure → Remaining 100U Guaranteed
Level 3 (400U→800U) Goal: Profit 280U Stop Loss: -200U Success → Principal reaches 1100U, enter Stable Strategy
Key discipline: No more than 3 times! Regardless of success or failure, switch to a conservative approach focusing only on BTC/ETH, rejecting altcoins (low liquidity, high spike risk)
II. 1100U phase: three-dimensional matrix strategy (ultra-short + swing + trend)
Capital allocation: Ultra-short trade (300U) → 15-minute quick in-and-out swing trade (500U) → 4-hour level trading + profit regular investment in BTC
Trend trades (200U) → Weekly major opportunity sniper funds (100U) → Emergency replenishment / sudden opportunities
1. Ultra-short trades (300U, intraday trading)
Strategy: 10x leverage, EMA12
++MACD+
(5,13,1) Signal entry: 15-minute candlestick breaks the last 3 highs + volume increase stop
Profit: 3%~5% (flexible trailing stop-loss) Stop-loss: 2% mandatory stop-loss fuse: consecutive 2 losses → pause for 1 hour
2. Swing trade (500U, 4-hour level)
Strategy: 5x leverage, Bollinger Bands
+ Narrow breakout entry: 4H Bollinger Band width <20% annual line, break above the upper band for long/below the lower band for short stop
Loss: 1.5x bandwidth profit handling: weekly profit 40% regular investment in BTC
3. Trend trades (200U, weekly opportunity)
Strategy: 3x leverage, wait for extreme market conditions: weekly RSI+
(14) <30 (oversold) or >70 (overbought) daily line continuous 3
To K-line 4-hour TD sequence +
=9 (reversal signal) Take profit: trailing stop-loss, profit/loss ratio ≥ 3:1
III. Ultimate risk control (life-and-death line)
Single-day loss > 15% → Mandatory rest for 24 hours; weekly profit > 30% → Halve leverage the next day; monthly withdraw 20% profit → Cash out for security
Summary: First 3 levels (100U × 3 times) → Rapidly accumulate capital later stage (1100U) → Ultra-short + swing + trend combination discipline > technology! Refuse to hold positions, refuse frequent trading
By doing this, you can achieve high returns while controlling risk, suitable for players starting with 300U!
Technology is the essence of survival; teaching someone to fish is better than giving them fish. Investing with small amounts for large returns is the true charm of investment, and holding onto assured profits is the foundation of financial management! Remember to bookmark and follow for continuous sharing of valuable insights in the crypto space, and let’s explore the wonders of the crypto circle together!
Have you ever realized that the market is in an uptrend, yet hesitated about whether to execute long trades? Perhaps you have concerns that the price may have exceeded the ideal entry level; or, you have mastered the ability to identify traditional bullish divergence signals and are now seeking a method to identify potential trend continuations. Based on the above considerations, hidden bullish divergence is exactly what you need.
The core content of this guide can be summarized as follows:
(1) Explore the differences between hidden divergence and conventional divergence, and understand how hidden divergence serves as an effective tool for trend continuation.
(2) Analyze how hidden divergence helps capture the remaining momentum of the trend.
(3) Master simple and efficient technical analysis methods to identify hidden bullish divergence, thereby enhancing confidence in trading decisions.
(4) Gain practical insights by examining actual trading examples, and demonstrate how to systematically implement hidden bullish divergence trading strategies.
(5) Recognizing the limitations of hidden divergence strategies and learning valuable techniques and strategies to overcome related challenges in order to enhance trading success rates.
2. What is hidden bullish divergence
To understand hidden bullish divergence more deeply, it is essential first to clarify the concept of regular divergence.
Regular bullish divergence occurs when the price forms lower lows, while technical indicators such as RSI (Relative Strength Index), stochastic indicators, or MACD (Moving Average Convergence Divergence) present higher lows. Traders typically interpret this phenomenon as a signal that, despite the price making new lows, potential bullish momentum has begun to show, and the downward momentum of the price has weakened compared to before.
Bullish divergence is often seen as an important indicator for considering potential market reversals. However, how is hidden bullish divergence formed? This divergence occurs when the price forms higher lows while the indicators form lower lows. In the context of a rising price trend, hidden bullish divergence can serve as a powerful analytical tool. Hidden bullish divergence effectively indicates that the momentum indicator has entered oversold territory in a market uptrend and is ready to continue rising, while the overall market trend serves as a catalyst for buy signals.
So, how does hidden bullish divergence differ from other patterns?
3. What does hidden divergence tell us: continuation or reversal
The core role of hidden divergence is to assist traders in identifying potential entry points within an established trend. Unlike regular divergence, which usually indicates a market reversal, hidden divergence constitutes a trend continuation trading setup. This means that when trading using hidden divergence, the goal is to capture price movements that align with the current market trend, allowing traders to leverage existing market momentum to trade.
(1) Trade in accordance with the trend
As the saying goes, 'The trend is a trader's friend,' this adage is also applicable when discussing hidden divergence trading strategies. Keeping the trading direction in line with the prevailing market trend allows traders to align with the overall market momentum. This approach is particularly effective when looking for trading entry points that are strongly supported by the established trend. Therefore, trading in accordance with the trend can position traders relatively favorably right from the start of their trades.
(2) Indicator selection
MACD (Moving Average Convergence Divergence), stochastic RSI, stochastic indicators, and regular RSI are several key technical analysis indicators that play an important role in identifying hidden bullish divergence. While other indicators can also be applied to divergence analysis, the ones mentioned above will be the core indicators primarily showcased in this example.
4. What does hidden bullish divergence look like
In the case of regular bullish divergence, the market price will create lower lows, while oscillating indicators or technical indicators will show higher lows. In contrast, hidden bullish divergence presents a different pattern. In this case, the market price forms higher lows, while the corresponding indicators will present lower lows. Next, let's observe this phenomenon more intuitively through the chart, as shown in the figure below.
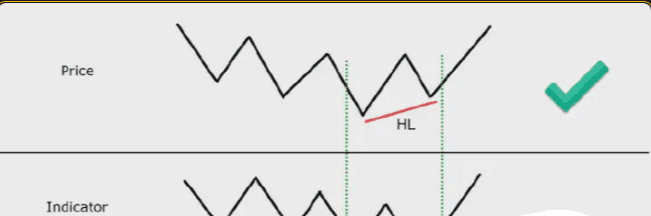
From the chart, it can be observed that the price initially formed a series of decreasing lows, but then began to form increasing lows. Meanwhile, the technical indicators recorded lower lows. This pattern indicates the formation of hidden bullish divergence. To further solidify this concept, let’s analyze another example, as shown in the figure below.
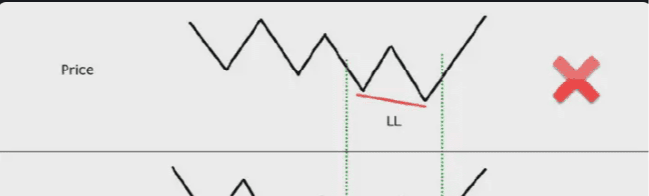
In fact, what we observe is not hidden bullish divergence, but rather a typical bullish divergence phenomenon. Clearly, in seeking the trend continuation setup indicated by hidden bullish divergence, this is not the target we pursue. Now that you have grasped this concept, we will examine some actual market chart examples so that you can accurately identify the signals to focus on in your trading process.
5. How to trade using hidden bullish divergence
Next, we will explore several actual market trading scenarios where the hidden bullish divergence trading strategy can be applied.
(1) GBP/USD 4-hour timeframe chart
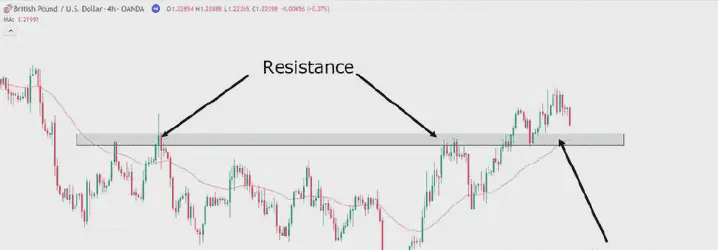
Please closely examine this chart. In this example, I used the RSI indicator with its default settings. You can see that, within the 4-hour timeframe, the market price formed a clear resistance level. After this resistance level was effectively broken, the price subsequently retraced to retest that area and successfully rebounded in that area, turning the original resistance level into a new support area. Now, let's use the hidden bullish divergence strategy to find the right timing to enter this area.
a. GBP/USD 4-hour timeframe hidden bullish divergence
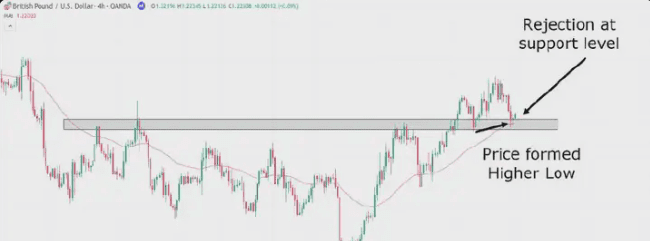
As you can observe in this chart, the price begins to show signs of rejecting a downward trend near some hammer candlestick patterns. More critically, our RSI indicator recorded lower lows while the price formed higher highs. This is a classic case of utilizing support to form potential hidden bullish divergence setups in a new uptrend.
In fact, several factors support this trade, thereby enhancing confidence in executing the trade:
1) Market trends are favorable for trading;
2) Hidden bullish divergence has emerged, signaling trend continuation;
3) The market is testing support levels;
4) and the candlestick patterns rejecting the downward trend indicate that the price has been held at the support level.
So, how will you operate for this trade? Let's explore further.
b. GBP/USD 4-hour timeframe chart entry scenario
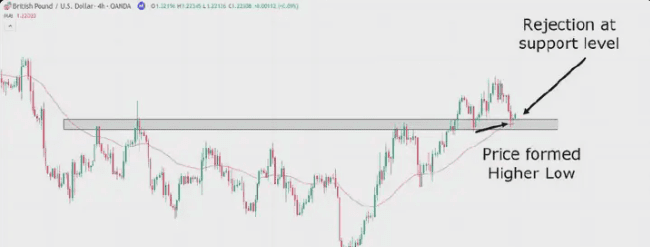
In the first scenario, traders can place stop-loss points below the 50-day moving average and support area. If the market price breaks below these levels, it indicates that the retracement may go deeper until it reaches other value areas. Traders can set profit targets above previous highs, making the trading process straightforward and efficient, allowing traders to quickly realize profits by entering and exiting the market. Next, let's examine the results of the trade.
c. GBP/USD 4-hour timeframe chart scenario #1 profit
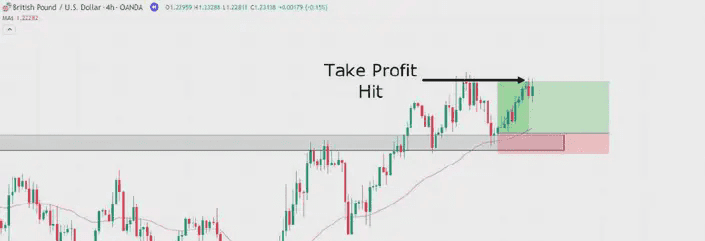
It is evident that the trading results are satisfactory. By simply setting the profit target at previous highs, a profit of about 2RR (risk-return ratio of 2:1) can be achieved, which is a reasonable and practical target. Another effective exit strategy is to set a trailing stop-loss point below the moving average, especially when traders seek to capture significant trend fluctuations. Now, let's observe what kind of results this method will bring in scenario #2.
d. GBP/USD 4-hour timeframe chart scenario #2 profit
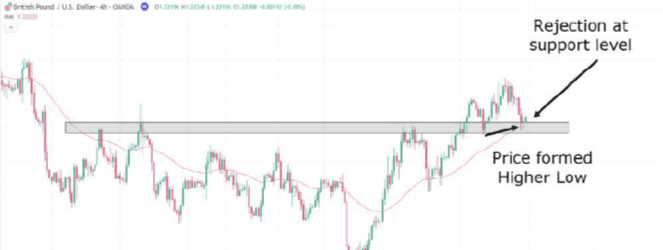
As you have observed, the market price indeed surpassed previous highs and continued to rise. However, as the price retraced, the trailing stop-loss did not keep up with the market's recent upward trend in time, indicating that the profit-taking strategy at previous highs in scenario #1 outperformed the strategy in scenario #2 in actual returns. So, can one method be considered superior to the other? In reality, it is not easy to claim which method is better. Although the profit-taking at previous highs in scenario #1 produced better results, it is important to understand that using a trailing stop-loss can often allow traders to better capture trends, especially when the trend starts to move strongly in a direction favorable to the traders. To further clarify this point, let’s analyze another example.
(2) NZD/JPY 4-hour timeframe chart
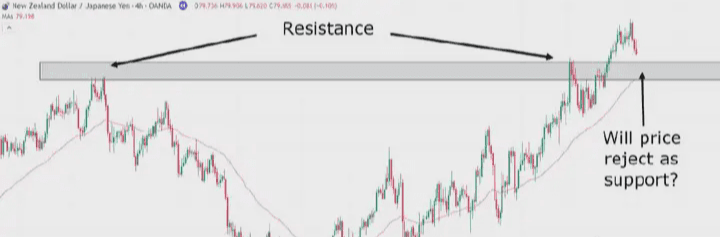
The situation here is very similar to previous cases, where the market price has established a clear resistance area. At this stage, you are waiting for a price rebound, turning the resistance level into a support level while being mindful of any signs of hidden bullish divergence that might appear.
a. NZD/JPY 4-hour timeframe chart hidden bullish divergence
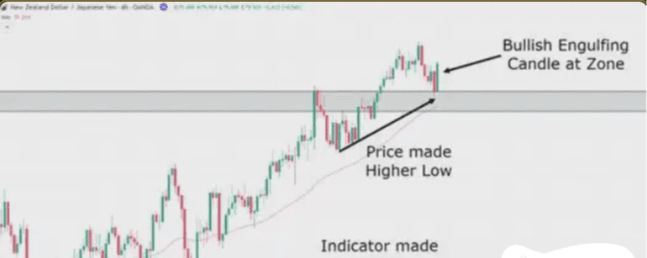
Please note this, the price formed higher lows while, at the same time, the indicators on the RSI panel formed lower lows. A bullish engulfing candlestick can also be observed in this area, which helps confirm that buyers are treating this area as support and provides a signal to buy; let’s proceed with the buy operation.
b. NZD/JPY 4-hour timeframe chart entry
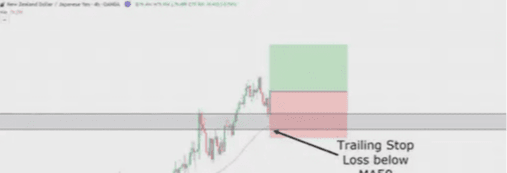
We can also enter trades after observing a bullish engulfing candlestick and set a trailing stop-loss below the 50-day moving average, so any violation of this stop-loss will trigger an automatic stop-loss or profit-taking.
c. NZD/JPY 4-hour timeframe chart entry
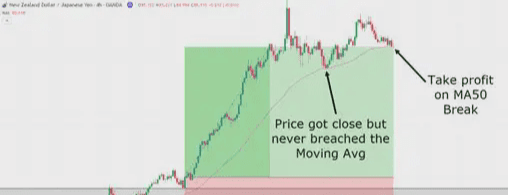
It is evident that you have just successfully captured the main trend of the market using the hidden bullish divergence strategy. Did you notice that the price almost touched the moving average but was actually treated as support? Subsequently, the price attempted to create a new historical high but failed, then broke below the moving average. The potential profit from this trade could be between 4 and 6, depending on your trailing stop-loss settings. Of course, it is important to understand that not every trade will go this smoothly. However, as long as you can seize one or two opportunities, you have a great chance of successfully applying the hidden bullish divergence strategy. To ensure your expectations align with reality, let’s review another example.
(3) CAD/JPY 4-hour timeframe chart input
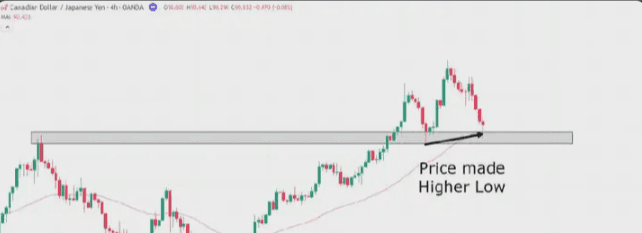
Like all previous examples, this trade setup follows the same pattern, with key value areas showing hidden bullish divergence. Let’s execute the trade and observe what happens when we again use the moving average as a trailing stop.
a. CAD/JPY 4-hour timeframe chart exit
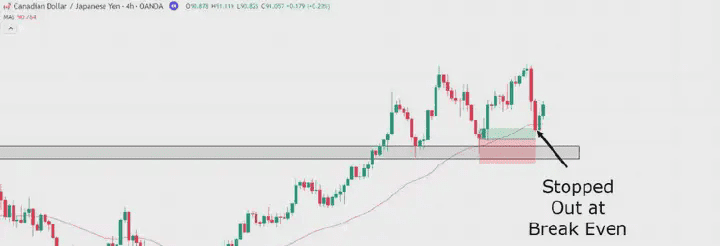
It is evident that an unfavorable situation has occurred. The market price did not continue the upward trend but broke below the moving average, gaining almost no profit. Of course, such situations can happen sometimes, but there is no need to worry. Let’s try again, this time we will focus on the 1-hour timeframe.
(4) GBP/CHF 1-hour timeframe chart entry
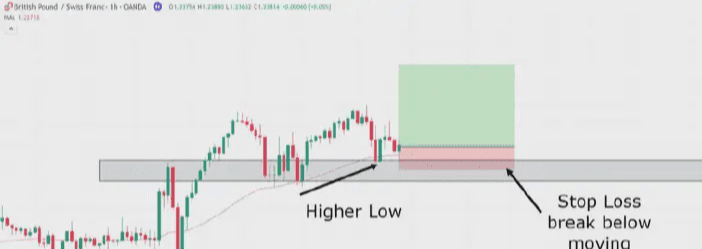
Similar to previous cases, the price experienced a transformation of support/resistance (S/R), and I used the moving average as a reference for support and trailing stop-loss. In this scenario, the price formed higher lows while the technical indicators formed lower lows. Therefore, for this specific example, assuming I firmly believe that a bullish trend is fully unfolding and want to maximize profits—by keeping the trade open until the price candlestick closes below the moving average. So, how did this trade progress?
a. GBP/CHF 1-hour timeframe chart exit
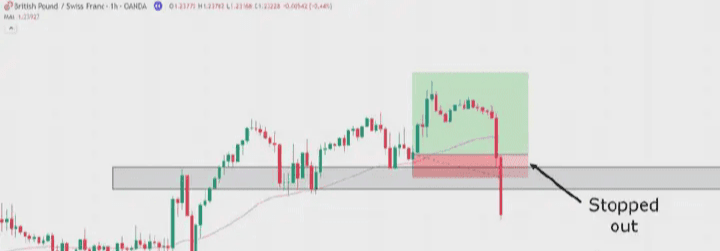
Unfortunately, I encountered a loss once again; let’s analyze this situation in depth.
b. GBP/CHF 1-hour timeframe chart analysis
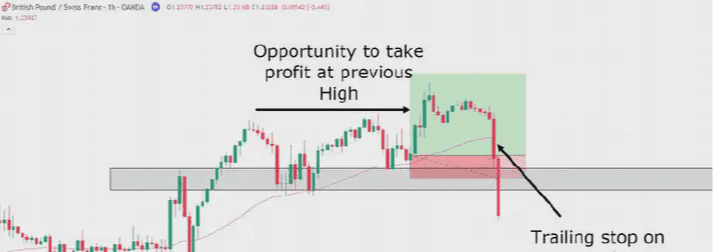
Analysis results indicate that there is an opportunity for profit-taking at previous highs, resulting in considerable trading gains. Although this may not achieve the 5RR (risk-return ratio) that traders pursue, capturing profits provided by the market is often a wise choice. Alternatively, if you choose to wait for a breakout of the moving average and set an automatic trailing stop-loss, the trade will be stopped out when the first substantive bearish engulfing candle appears, as it begins to break the moving average. Therefore, by setting a trailing stop-loss instead of relying on the candlestick close to exit the trade, losses can be effectively avoided.
Please remember, risk management is crucial. Recognize that the hidden bullish divergence strategy does not always develop as expected, and this applies to any other trading model. Losses are inevitable in trading, but you can control the extent of these losses. By analyzing our failed trades, we find that the strategy itself is often not the issue, but rather the management of the strategy. Therefore, the hidden bullish divergence strategy provides a framework to maximize potential profits while limiting risks. Of course, this strategy also has some other limitations.
6. Limitations brought by hidden bullish divergence
(1) May be difficult to discover
Unlike regular bullish divergence, hidden bullish divergence is termed 'hidden' because it is actually difficult to detect. Looking for lower lows in the indicators can be very challenging, especially in a bullish market where most momentum is pushing indicators and prices upwards.
(2) Relatively uncommon
Compared to standard divergence, hidden bullish divergence is less common. When it occurs, it can be a useful tool, but due to the nature of the setup, identifying and effectively using it requires more time and thought.
(3) Cannot be used under all market conditions
This difficulty is due to the relative rarity of hidden bullish divergence. As a trader, you are only looking for this pattern to appear in a bullish market. Therefore, this means you can only truly apply this strategy when observing an uptrend.
(4) Late
One advantage of hidden bullish divergence is that it requires thorough confirmation before triggering a buy signal. However, this can also bring another limitation: by the time the necessary confirmation process is completed, the market price may have already deviated from the optimal entry point or the starting point of the trend, becoming too far.
(5) Realistic expectations
Like all strategies, the hidden bullish divergence strategy does not guarantee a 100% success rate. Any indicator or method has its limitations, so expecting these trades to succeed every time is unrealistic. For the hidden bullish divergence strategy, it is crucial to practice different approaches and indicators to determine which method best suits your trading timeframe and the asset classes you are trading.
7. Tips and tricks to improve success rates
As previously mentioned, it is important to recognize that not all trades will be successful. However, there are valuable tips and tricks that can help you identify potential trading risks before further confirmations, thus increasing the likelihood of trading success.
(1) Indicator crossover
Some technical indicators used for divergence analysis contain two lines that cross each other. Taking the stochastic RSI crossover as an example, as shown in the figure below.
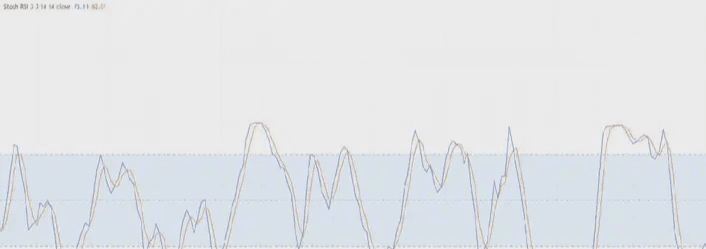
Taking the stochastic indicator as an example, when the market price forms lower lows, the two lines on the indicator have not yet crossed. Waiting for this crossover to occur can allow traders to enter the market when the momentum truly shifts to a bullish trend. In some cases, this may mean trading will occur later, but this wait provides the additional confidence needed when making trading decisions.
(2) Oversold area
Although the direct relevance of overbought and oversold zones to hidden divergence scenarios is not high, it is worth noting that if your trade setups are in the oversold area, waiting for the price to exit the oversold range may be beneficial. Taking stochastic RSI oversold as an example, as shown in the figure below.
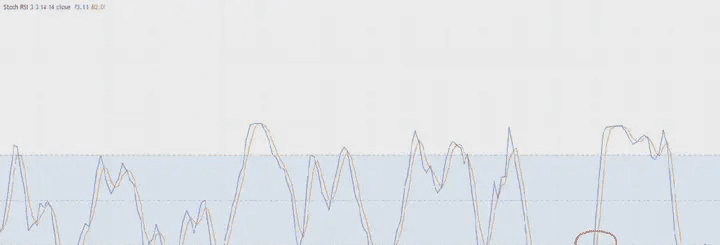
In some cases, when the price is in an oversold area and forms lower lows of hidden bullish divergence, it may be wiser to wait for the indicators to exit the oversold area. Then, when the market trend truly begins to turn bullish, traders can enter trades.
(3) Patience
Last but not least, all of the above relies on a core element—patience. Traders often rush to participate in every potential trading opportunity they see. However, it is crucial to remain calm and only adopt the best trading setups. When using the above techniques, please be patient and wait for them to appear. Although patience may cause you to miss certain trading opportunities, trust me, it will help you avoid overtrading, selecting the wrong trading setups, and enhance your confidence in your trading strategy.
8. Conclusion
Here are the core points of this guide summarized:
(1) Deeply understand the differences between regular bullish divergence and hidden bullish divergence, and be able to identify the market environments suitable for each type of divergence condition.
(2) Through insights gained from actual trading cases, you now have a set of tools to trade using market momentum, thus mastering the advantage of trading from the very beginning.
(3) Practical trading setups provide you with various profit-taking and stop-loss options, ensuring you can effectively manage trades, regardless of how the market develops.
(4) By deeply studying the limitations of hidden bullish divergence, you can trade with a realistic attitude, cultivating a flexible trading mindset.
(5) This article provides valuable tips and techniques to prevent entering the market too early, ensuring you have the confirmations needed for confident trading.
Investors in the crypto space, whether beginners or experts, gain not only financial returns from A Xun but also growth in investment knowledge and experience.
In the investment process of all dedicated fans, A Xun will not only provide investors with analytical thinking, basic knowledge of market watching, and various investment tools, but also bring you exciting fundamental interpretations, sorting out the aftermath of chaotic international affairs, and distinguishing various investment forces.
A Xun allows you to be both a winner and an expert in your investments!
Currently in a bull market, with opportunities every day, we share passwords.
Still the same saying, if you don't know how to operate in a bull market, click on A Xun's avatar, follow me, and I will share the planning for bull market spot trading and contract passwords for free.
I need fans; you need references. Guessing is not as good as following.
A Xun only does real trading, the team still has spots available. Speed up to join $BTC $ETH