

No matter how much capital, do not hold more than five coins: Regardless of the amount of capital, the number of cryptocurrencies held should not be too many to avoid management difficulties.
1. Capital Management: Act within your means and diversify risks
Within 100,000, focus on holding one coin: When the capital is small, concentrate on holding a potential coin and conduct in-depth research on its fundamentals and technicals.
200,000 to 300,000, play with two coins: When there is slightly more capital, it can be diversified into two coins to reduce the risk of a single cryptocurrency.
Within 500,000, three to four is enough: As capital increases further, hold a maximum of three to four coins to avoid excessive diversification.
No matter how much capital you have, do not exceed five cryptocurrencies: Regardless of the capital amount, the number of cryptocurrencies held should not be too many to avoid management difficulties.
Focus firepower in a bull market, and respond lightly in a bear market: During a bull market, concentrate funds on the most promising cryptocurrencies; when the market is poor, operate lightly to reduce losses, and if you lose, you can withdraw in time.
2. Trend is king: Follow the market, do not go against the trend.
Watch the news, learn the technology: Understand market dynamics and technical indicators to improve investment success rates.
Downward rebounds are often traps, while upward pullbacks may be pitfalls: Do not blindly bottom fish or chase highs; follow the trend to operate.
Do not guess the intentions of main forces: Market main forces are difficult to predict, focus on your own investment strategy.
3. Only act when the market is lively, respond flexibly
Act when the market is active: When market enthusiasm is high, investor sentiment is positive, making it easier to seize opportunities.
Operate flexibly, do not be rigid: Adjust strategies in a timely manner according to market changes, without sticking to old patterns.
4. Stop-loss and take-profit: Protect the principal and lock in profits
Set fixed stop-loss points: Stop losses in time when losing to avoid greater losses.
Gradually raise the selling price: Gradually increase the selling price when profitable to ensure profits are not lost.
I know an elder who invested 100,000 yuan and now has a market value of 10 million. He once told me something that enlightened me. He said, 'The cryptocurrency market is full of a crowd, you just need to control your emotions, and this market is a cash machine!'
I was born in 1980, 45 years old, with a net asset of over 50 million, of which about 47 million was earned from 'trading cryptocurrencies.' I have never used leverage and am preparing to borrow shells for private placement.
There is a 'foolproof' way to trade cryptocurrencies, following the market makers is very simple! Share it with those who come across this article.
As someone who has experienced three rounds of bull and bear markets, here are three things you must not do in the cryptocurrency circle.
1: Do not touch contracts, do not hold positions, do not chase low-quality coins.
2: The most dangerous thing is to frequently buy and sell chasing highs and cutting losses.
3: The most dangerous thing is to put all your cryptocurrencies in one wallet address or on an exchange, which is more dangerous than trading futures with leverage.
Next, I will bring you pure dry goods, which are the most important things to do in the cryptocurrency circle.
1: Regular investment in mainstream and leading cryptocurrencies.
Regular investment is better than a one-time buy; full investment has a higher probability of making money. If you invest all at once and the price falls afterward, it will be more difficult to average down. Watching the low price, you can't accumulate more coins, which is particularly uncomfortable, and you miss the opportunity to lower costs. Even in a bull market, your profits will be significantly less.
2. Enhance the ability to make money off-market
In the market, the main thing is to buy cryptocurrencies more, accumulate them. If you want to hold onto your coins, you need to enhance your ability to make money off-market. The ability to make money depends on the work you do. If you have a lot of time, invest more in yourself, learn more skills, and following me to become a Twitter KOL can turn traffic into cash.
3. Invest more in fields you are familiar with
Invest more in fields you are familiar with, which will help you better control risks. If you invest in things you do not understand, the losses will be greater. Investing in your familiar fields increases cash flow, and with cash flow, you can obtain more profits, thereby avoiding selling your valuable cryptocurrencies due to price drops.
4. In-depth research on the techniques of speculative trading
Familiarize yourself with the development trajectory of historical hundredfold cryptocurrencies. You need to establish your own profitable trading strategy and continuously optimize the ideas for selecting coins and timing in practice.
Tips for learning to trade cryptocurrencies:
1. Invest spare money, avoid borrowing money to trade cryptocurrencies—invest money + invest effort
2. Rigorously filter valuable cryptocurrencies and make reasonable fund allocation plans that align with reality—Sunshine Investment Strategy +
3. Averaging down—it's normal to have pullbacks after entering the market, so funds should be allocated reasonably and entered in batches.
4. Refuse to go all in; allocate positions reasonably. Do not put all eggs in one basket to effectively reduce risks.
5. Keep an eye on the surroundings—look at cryptocurrency news, the latest financial and economic information. The earlier you know, the earlier you understand and make money.
6. Think differently, do not oppose the market makers or the trend. Go with the flow and act in accordance with the trend.
7. Open contracts, do not over-invest, leverage below 5 times, do not easily use 100x leverage. It is best to avoid leverage and seek stable profits instead of overnight wealth.
8. Managing your own profits—managing your positions is more important than anything else. If you are unsure, do not trade easily. Not trading means no risk and therefore no loss. Spend more time looking at your assets, checking whether they are being managed and if the management is reasonable.
9. The bottom is in the heart, the top is in the heart. Do not be afraid, the cryptocurrency market will only make you grow. Mindset is more important than operation. Everyone should remember the method of trading cryptocurrencies; there's no need to worry about not making money!
I have specially compiled 【Price Action - The Ultimate Guide to Using Trend Lines!】 to share with those destined to receive it. Remember to like and bookmark it. Everyone, follow Yiyan, and I will share more content with you later.
1. Introduction
In previous discussions, some complex trend line strategies were mentioned, such as different types of trend lines and trend line breakout strategies.
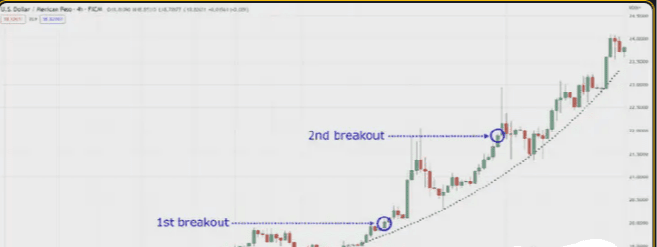
Figure 1.1 Different Types of Trend Lines
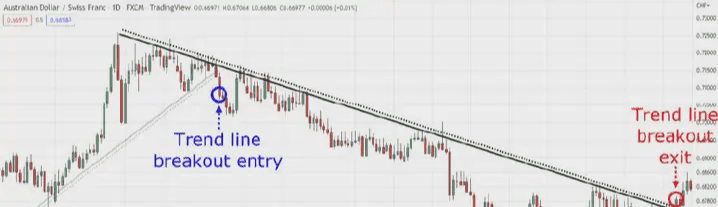
Figure 1.2 Trend Line Breakout Strategy
In this trend line guide, you will gain the following knowledge:
(1) The definition of trend lines and their operational mechanisms and reasons for existence in most markets;
(2) How to use trend lines to generate lower-risk, higher-return trading ideas;
(3) Use trend lines for easy entry, effective management, and timely exit in trading;
(4) In learning to use trend lines, there are some key pitfalls and suggestions to avoid.
2. How to use trend lines: What they are and how they work
The key to learning any new trading concept is to first understand the principles behind it and the potential problems that may arise. Therefore, when exploring trading strategies, it is inappropriate to directly ask, 'What is the ideal moving average period?' Instead, you should shift to asking, 'Why do I need to choose a specific moving average period?' Similarly, when discussing trend line strategies, do not simply seek the best trend line strategy but delve into thinking, 'Why do trend lines work in the market?'
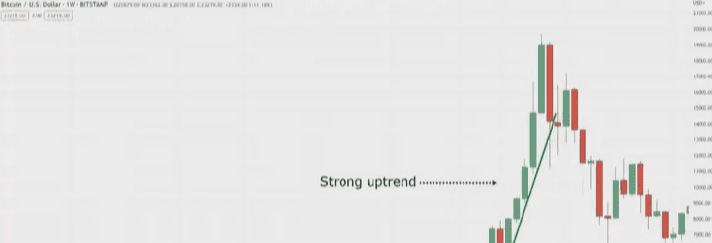
Next, let’s explore in detail the mechanisms of trend lines in the market. As we know, market trends are diverse, including strong trends, mild trends, and no trend states. By deeply understanding trend lines, we can better grasp market dynamics to develop more effective trading strategies.
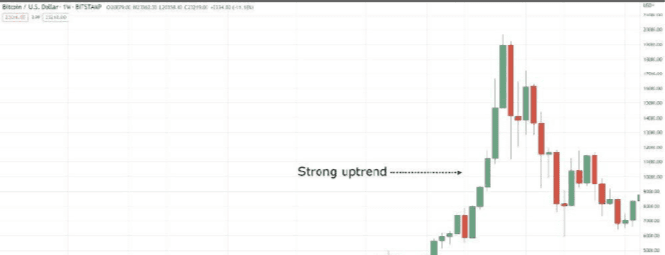
Figure 2.1 Strong Trend State
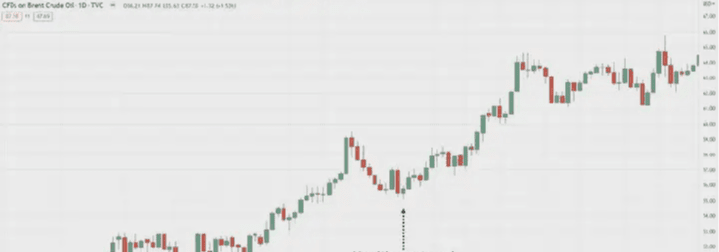
Figure 2.2 Mild Trend State
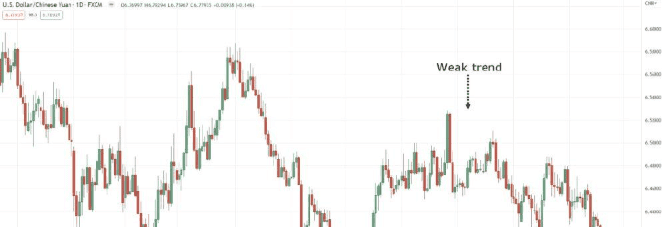
Figure 2.3 No Trend State
In simple terms, the role of trend lines is to identify value areas, as shown in the figure below.

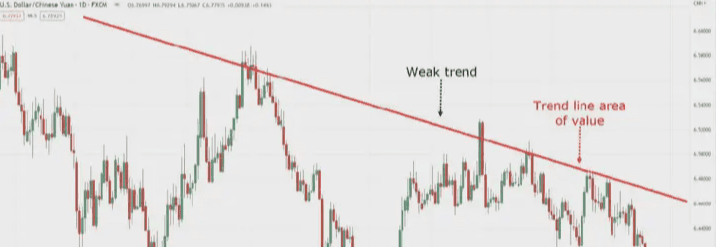
When market trends emerge, we discover and seize potential opportunities within the market. Using trend lines is not meant for market prediction but to appropriately respond to the existing market conditions.
Now that you understand the principles behind trend lines, let’s explore how to effectively use trend lines in practical operations. We will start with basic application steps and gradually delve deeper into the specific methods of using trend lines in trading practice.
3. How to draw trend lines on the chart
In fact, like any technical analysis tool, correctly using trend lines requires a certain amount of practice and training. Therefore, during the learning and application process, you may inadvertently draw trend lines inaccurately, which is a normal learning process that does not require excessive worry.
However, it must be recognized that the effectiveness of trend lines is only realized when there are two or more fluctuation points in the market. For example, in an uptrend, one should focus on identifying and connecting consecutive lows as part of the trend line, as shown in the figure below.
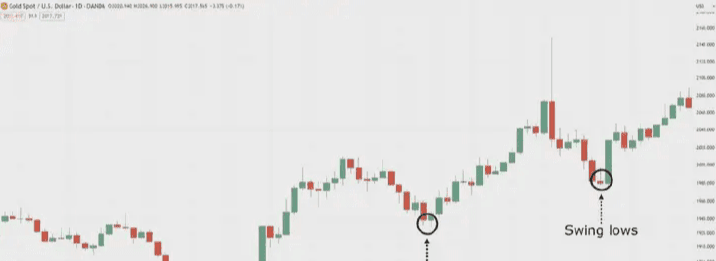
Once two significant swing lows form on the market chart, you need to make a 'forecast' to infer where the next potential swing low might appear, as shown in the figure below.
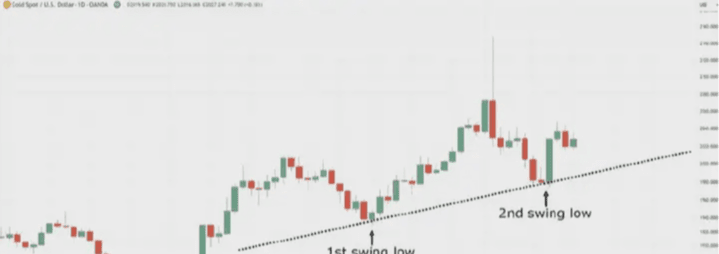
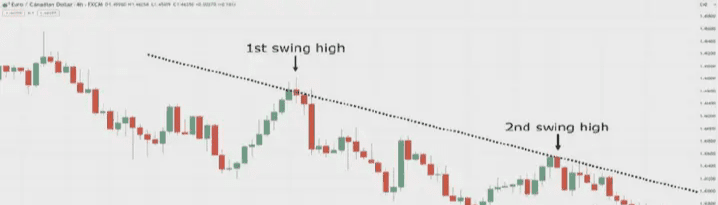
When dealing with downward trends, attention should be focused on the market's fluctuation highs, not the fluctuation lows, as shown in the figure below.
4. How to use trend lines to accurately analyze the market
In financial market analysis, trend lines are a fundamental and widely used tool. Although their construction principles are simple, their application in practice involves various techniques. In this section, I will introduce these techniques. First, we will explore how to identify the strength of trends, which is a relatively straightforward technique.
Reviewing what was mentioned earlier, we draw trend lines by connecting the highs or lows of price fluctuations. Based on this, one method to determine whether the market trend is accelerating upward is to observe whether the swing lows on the trend line are showing a successive upward trend, as shown in the figure below.
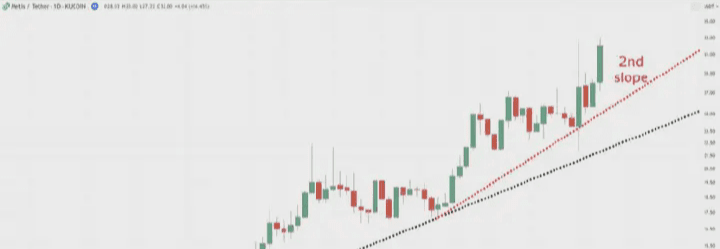
After drawing an effective trend line following the correct technical analysis procedure, if the market chart shows the price fluctuation's downward extreme point for the third time, the so-called third swing low, further market trend analysis can be conducted at this point, as shown in the figure below.
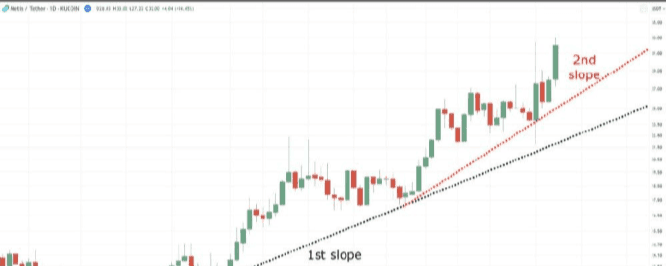
Then, after identifying the second price fluctuation low, draw a new trend line that extends based on this low point and its prior related low point, as shown in the figure below.
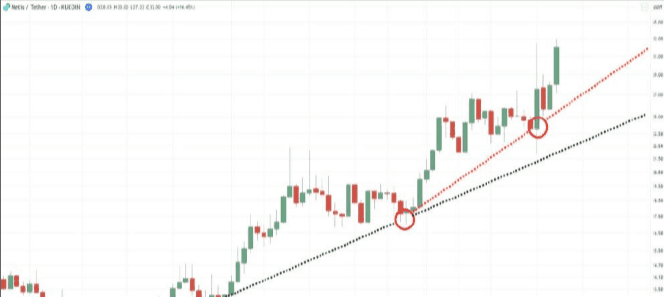
If the trend line shows a sustained incline, it indicates that the market trend is accelerating. The importance of this observation is reflected in several aspects: when the trend accelerates, the following situations may occur:
(1) The price has further upward potential;
(2) Price pullbacks may be relatively rare;
(3) Nevertheless, the market still has the potential for significant fluctuations.
The figure below shows a specific example illustrating this phenomenon.
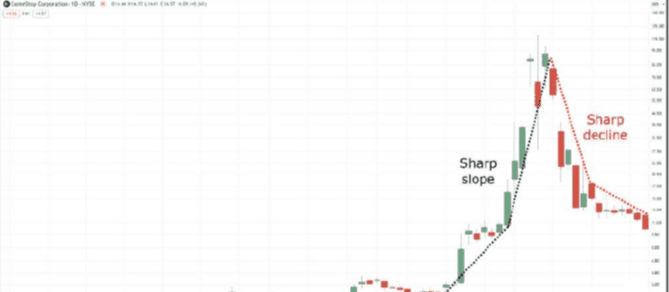
On the other hand, if the lows of price fluctuations begin to show a downward trend, it may indicate that the opposite market condition will occur, as shown in the figure below.
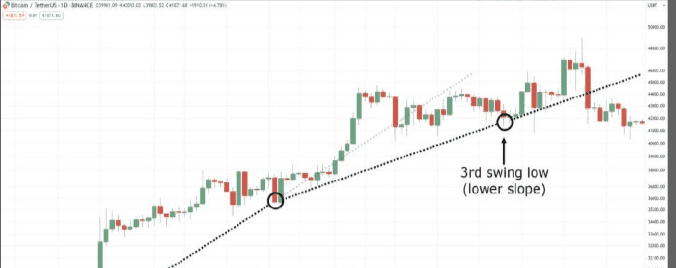
This phenomenon indicates that the strength of the market trend is weakening and may develop into a range-bound or sideways market state. Is this analysis reasonable?
Before further discussion, please ensure that the scale of your market chart is set to logarithmic scale for more accurate technical analysis, as shown in the figure below.
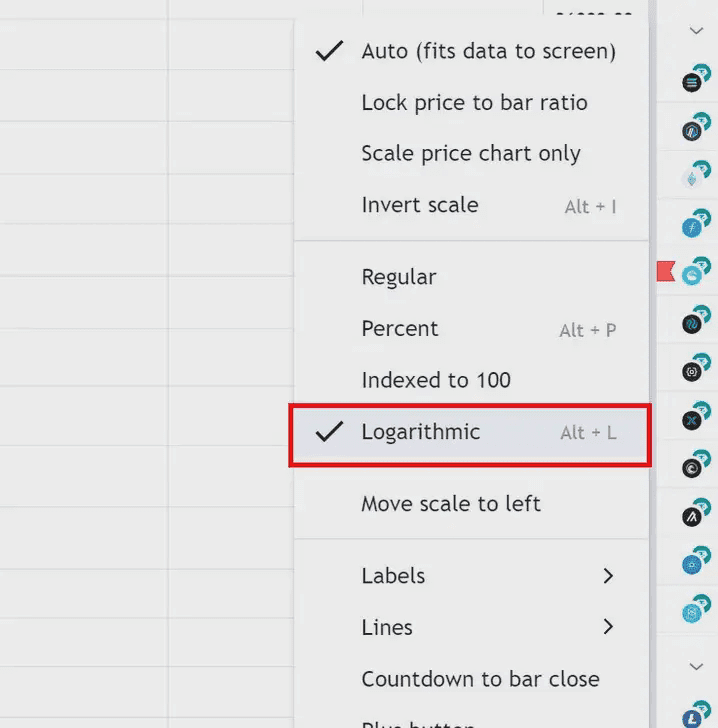
The importance of this argument is sufficient to support it as an independent guiding principle. However, using logarithmic scales can help you to view market charts from a more objective perspective.
To conduct effective comparative analysis, the figure below presents an example of a market chart that does not use logarithmic scale.
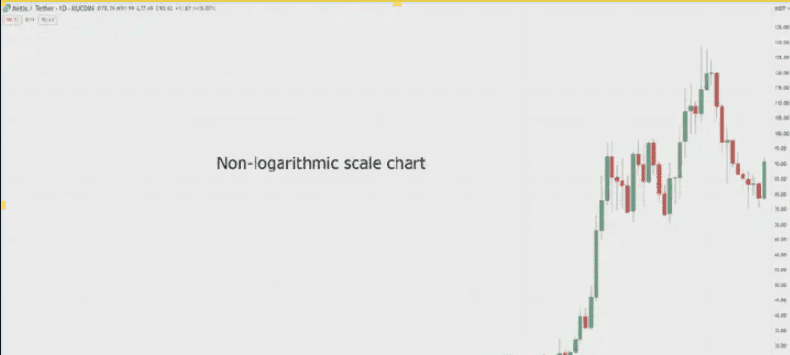
As shown in the figure below, this displays the same market chart corresponding to the previous one, but drawn using logarithmic scale.
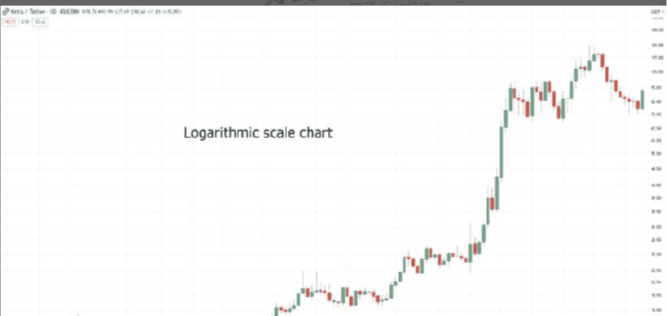
It is evident that there are significant differences between these two charts. Under logarithmic scales, the lows and highs of price fluctuations are more pronounced, which may be extremely important for mastering how to use trend lines for market analysis.
5. Grasp the timing of market trend reversals
Another key concept in using trend lines for market analysis is to grasp the timing of market trend reversals, as shown in the figure below.
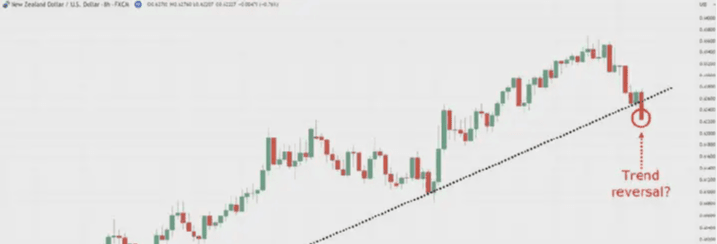
However, it must be recognized that a single candlestick chart is not sufficient to completely reverse an established market trend. This is because, in financial markets, false breakouts are common, as shown in the figure below.
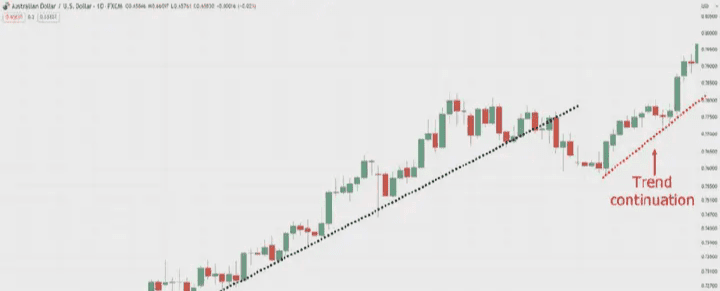
So, how should we use trend lines to accurately identify market trend reversals? The answer lies in seeking additional confirmation signals, as shown in the figure below.
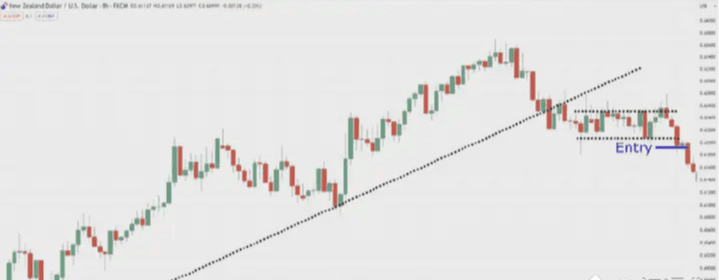
Indeed, waiting for the bear market flag pattern, and then breaking through this pattern is enough to tell us that the market structure has changed, as shown in the figure below.
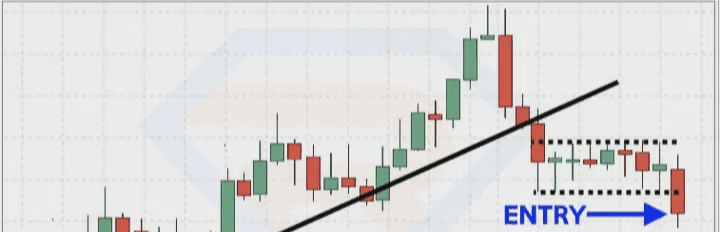
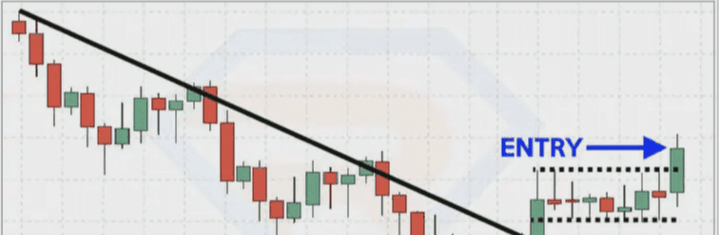
As shown in the figure below, this is what it looks like after a long-term setup.
Now that we understand how trend lines are formed and how to use them for market analysis, the next question is how to use trend lines to achieve profits in the market. I will detail this strategy in the subsequent sections.
6. How to use trend lines to enter, manage, and exit trades
If a trading concept cannot help improve the trader's operational level, then its existence value is questionable. After all, analyzing and understanding the dynamics of the actual market and the flow of funds are two entirely different processes.
(1) How to use trend lines to enter pullbacks
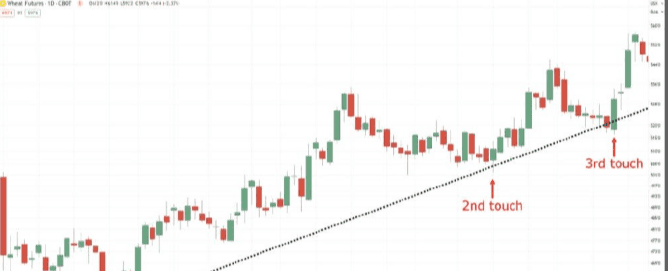
How to use trend lines for trade entry during market pullbacks, which may be one of the most classic trading techniques, is crucially about patiently waiting for the market to touch the trend line for the third time, as shown in the figure below.
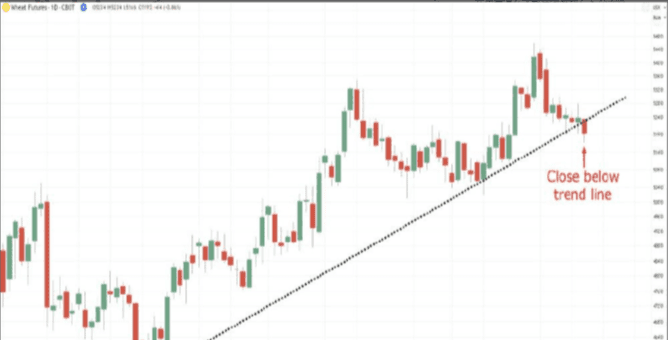
But when should buy operations be executed? Usually, trading books do not clarify this point, and the specific operation steps are as follows: First, patiently wait for the price to close below the trend line, as shown in the figure below.
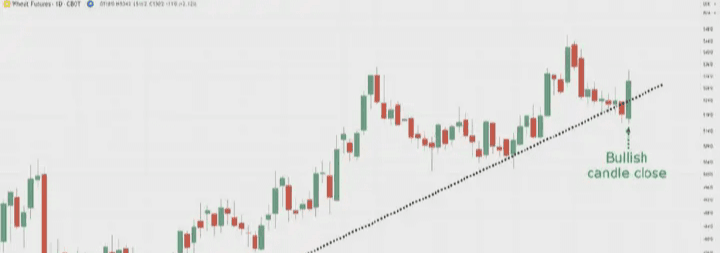
Once the price forms a bullish candlestick close, as shown in the figure below.
Then, enter at the opening of the next candlestick, as shown in the figure below.
This is essentially a standard operating procedure for identifying common chart patterns and trend lines. The more knowledge you master, the more adept you will be at operations. Meanwhile, it is worth considering how to respond if the trend line presents a significant inclination as previously discussed.
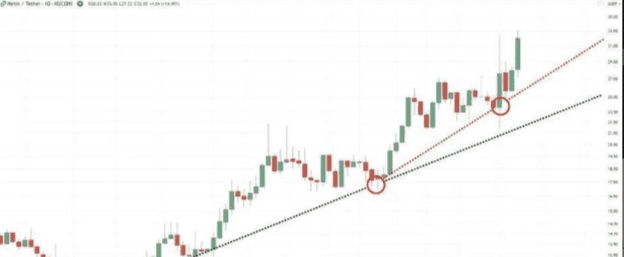
The methods shown in the figure above are needed to master how to effectively use trend lines when executing breakout trades.
(2) How to use trend lines to enter breakouts
Previously, I have been guiding how to use trend lines to objectively analyze market trends. This time, the content is different, demonstrating how to use trend lines to objectively assess market pullbacks (to simplify the discussion, the term 'trend line' will be used without introducing the concept of a 'pullback line'), with examples provided.
If facing an upward market trend, as shown in the figure below.
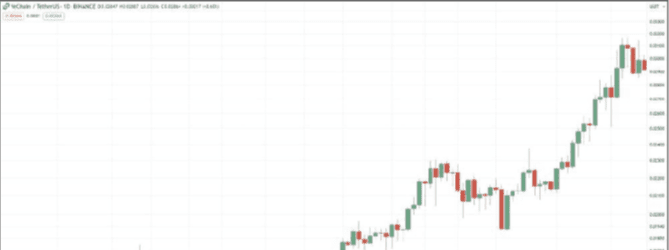
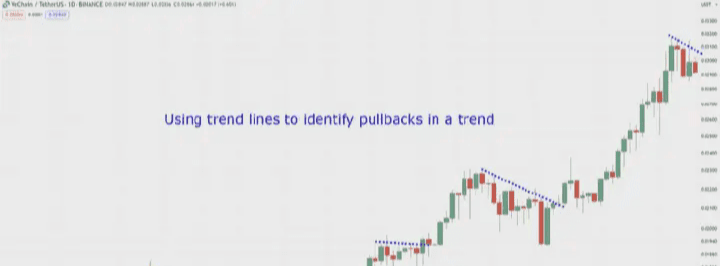
Position the trend line at the highs of the pullbacks (pullbacks can take various shapes and sizes, as well as trends), as shown in the figure below.
When it closes with bullish momentum, it will explode, as shown in the figure below.
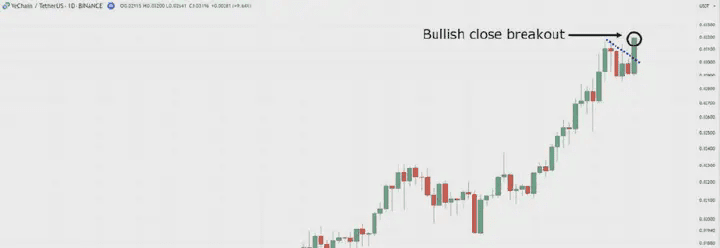
Next, move to the next candlestick, as shown in the figure below.
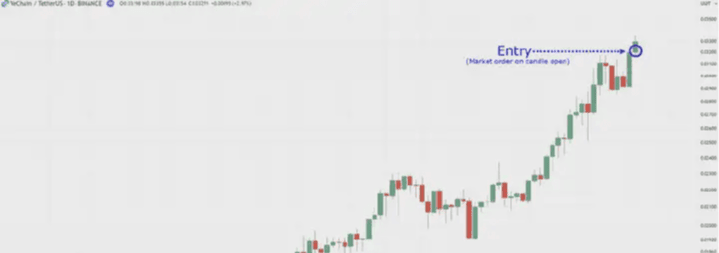
Similar to drawing trend lines, since the extent and form of market pullbacks may vary, determining the trend line during pullbacks may require a certain amount of effort and time. However, once you master this technique, you will be able to effectively identify potential trading opportunities during market pullbacks and breakout moments.
(3) How to profit using trend lines
As shown in the figure below, it demonstrates trend reversal setups.
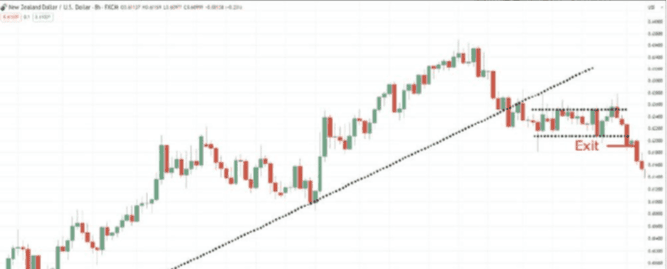
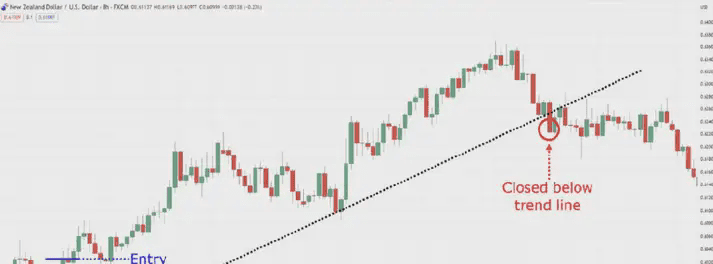
Imagine being in a trading process where we do not expect to see a flag pattern. Because this pattern may lead to unnecessary time consumption and may cause significant losses. Conversely, once the price closes below the trend line, as shown in the figure below.
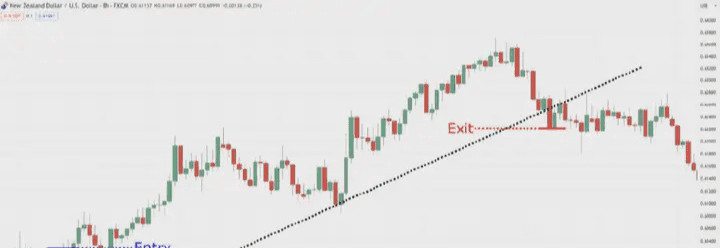
Then exit at the opening of the next candlestick, as shown in the figure below.
In the following chapters, I will guide you on how to further enhance this skill. However, from a fundamental perspective, this content has already covered the necessary knowledge. At this stage, you have mastered how to use trend lines to assist in trade entry and exit, and realized the importance of trend lines in the trading toolbox. At the same time, it is equally crucial to master when not to rely on trend lines.
7. Avoid misusing trend lines
(1) The biggest mistake when learning to use trend lines is drawing too many trend lines, as shown in the figure below.
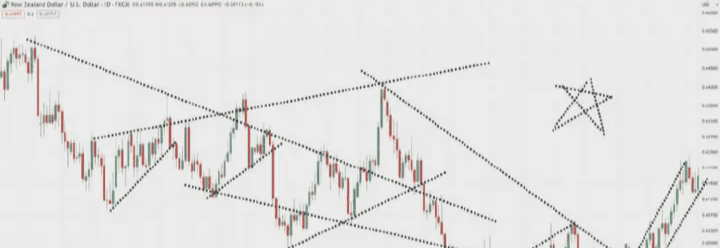
In chart analysis, the number of trend lines should be limited, usually not exceeding three. The reason is that only trend lines directly related to the current market price need to be drawn, as shown in the figure below.
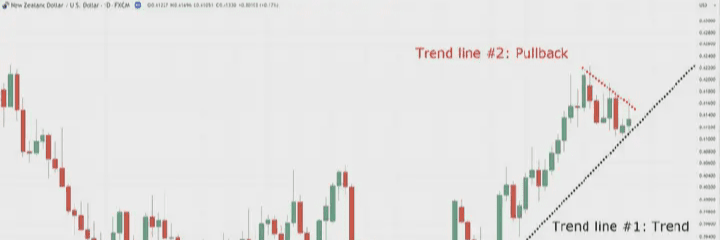
As shown in the figure above, a trend line was used to identify market trends, while another trend line was used to identify market pullbacks. These two trend lines serve their respective purposes with clear uses.
In conclusion, one can decide how many trend lines to draw, provided that:
1) They maintain relevance to the current market price;
2) Being able to use the information provided by these trend lines to manage trades more effectively;
It is important to avoid overcomplicating the drawing of trend lines.
(2) The next thing you should not do with trend lines is to treat them as a line on the chart.
Given that the market's actual performance is reflected in specific areas on the chart, it is valuable to examine such trend lines, as shown in the figure below.
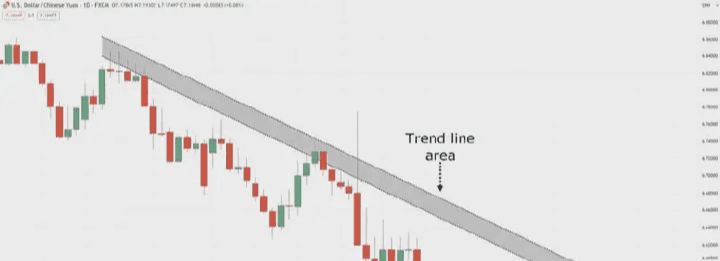
Because in some cases, the actual movement of the market may not match the patterns drawn on the chart, or this match may experience delays.
However, when the market responds to your trend line area, as shown in the figure below.
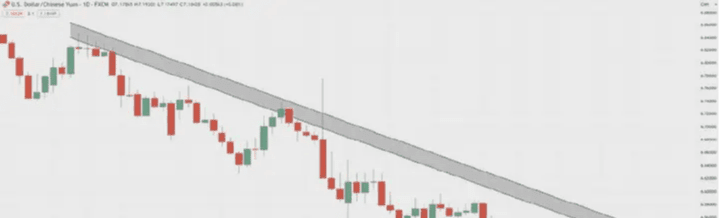
This indicates that the market has met your trend line, and this method is another way to improve market participation. By treating trend lines as 'regions', enough space can be provided for the market to respond to your trading ideas.
8. Conclusion
Here are the core points of this guide:
(1) The main function of trend lines is to visually demonstrate the value range within market trends.
(2) In an upward market trend, draw trend lines by connecting the fluctuation lows, while in a downward market trend, connect the fluctuation highs.
(3) The slope of the trend line is determined by the fluctuation highs or lows and can be used to judge whether the market trend is strengthening or weakening.
(4) Traders can use trend lines to operate during market pullbacks, waiting for the market to touch the trend line for the third or more times.
(5) If the price breaks through the pullback trend line, traders can also engage in breakout trading based on this.
(6) Only draw trend lines that are directly relevant to your trading strategy and always treat trend lines as a regional analytical tool on the chart.
Cryptocurrency investors, whether novices or experts, gain not only financial returns but also growth in investment knowledge and experience from Ah Xun.
In all the investment processes of iron fans, Ah Xun not only provides investors with analytical thinking for market trends, basic knowledge of watching the market, and methods for using various investment tools, but Yiyan will also bring exciting fundamental interpretations, sorting out the confusion of international trends, and identifying various investment forces.
Yiyan allows you to be both a winner and an expert in investment!
Currently, in a bull market, opportunities arise every day with password sharing.
Still the same saying, if you don’t know what to do in a bull market, click on Ah Xun’s avatar to follow, and get free sharing of bull market spot planning and contract passwords.
I need fans, you need references. Guessing is not as good as following.
Ah Xun only engages in real trading, the team still has positions available, speed up to join $ETH $BTC