

This is an exciting question and also the easiest one to mislead. Because in this market, the speed of making money can be faster than you imagine, but those who can truly reach the finish line are rare.
1. Question: The speed of making money in the cryptocurrency circle is infinitely magnified.
In traditional financial markets, a stock might take ten years to multiply tenfold.
In the cryptocurrency circle, this speed is often compressed to a few years, or even a few months.
Case 1: Bitcoin Pizza - In 2010, a programmer used 10,000 bitcoins to exchange for two pizzas. By 2021, these bitcoins were worth over 600 million dollars.

Case 2: Ethereum ICO – In 2014, the public offering price of ETH was less than $1, and in 2021 it broke through $4,000 at its highest. Many early participants achieved a leap in wealth in one bull market.

Therefore, the time it takes to "earn 100 million" in the cryptocurrency world might be a bull market, or even just a three-month frenzy.
II. Analysis: The Huge Risks Behind Wealth Myths
However, this speed is always a double-edged sword.
It can make you 100 million in three months, or it can make you lose it all in three days.
Case 3: LUNA Crash – In 2022, LUNA's market value plummeted from tens of billions of dollars to almost zero in just one week. People who were millionaires one day were penniless the next.
Case 4: FTX Bankruptcy – The exchange, hailed as the "Wall Street of the crypto world," collapsed instantly, locking up the funds of millions of investors. Some had planned to "wait for another bull market," but their dreams of wealth were shattered.
Therefore, the question is not "how long", but whether you can weather the risks and hold onto your assets.
III. Solution: The real path is not time, but cognition.
Instead of asking "How long will it take to earn 100 million?", it's better to ask: Do you have a long-term perspective and the right understanding?

The patience of long-term holders: Many Bitcoin believers have endured countless price drops, persisted in holding their Bitcoins, and finally achieved financial freedom.
Entrepreneurs' long-term strategy: Binance founder Changpeng Zhao (CZ) founded the exchange in 2017 and built it from scratch in just a few years, relying on trend judgment and long-term strategy rather than luck.
The real answer is:
In the cryptocurrency world, wealth is merely the result; understanding and mindset are the true competitive advantage.
When you're ready, 100 million might take three, ten, or even longer, but it will definitely...
Okay, back to reality. Let me tell you how long it took me to make my first fortune in the crypto world. If you like stories, you can read on patiently; even I find it quite fantastical when I think about it now.
I'm Yiyan, a veteran crypto investor with ten years of experience. I'm currently a mentor in the crypto community. Follow me if you'd like to learn more or join the community to copy my trades.
I started with 50,000 in the cryptocurrency market, made 10 million, then went into 8 million in debt, then back to a profit of 20 million, and now I'm financially free. In the past two years, from December 23, 2021 to August 6, 2023, I started with less than 500,000 and achieved a return of 418,134.86%, turning it into over 29 million. Here's some practical and useful advice for those new to the cryptocurrency market!
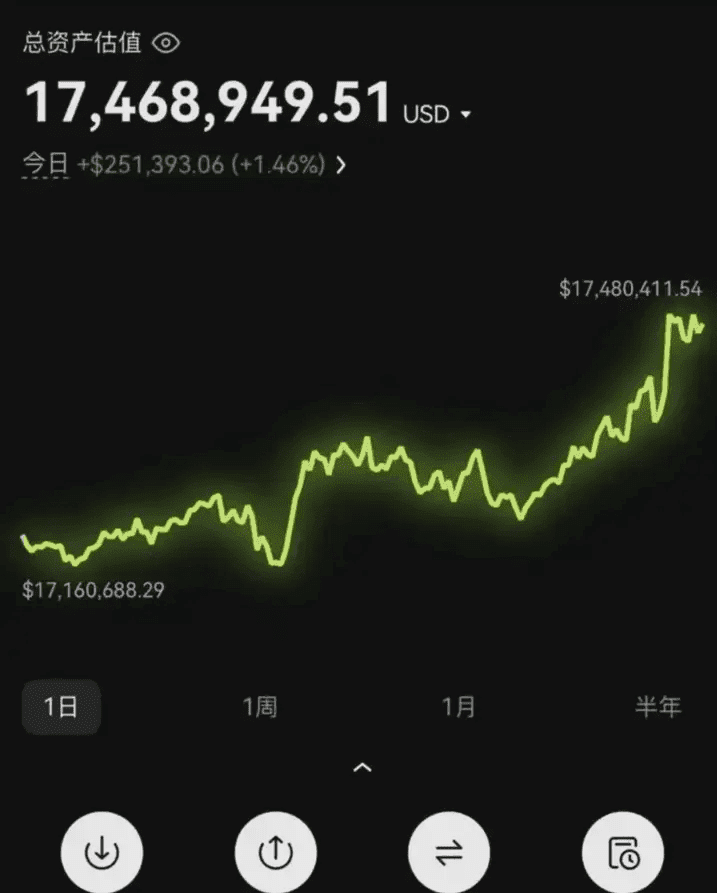
Crypto futures trading is like gambling, even more addictive than drugs! As someone who's been there, I was liquidated three times in one year, accumulating 8 million yuan in debt. It took me three years to pay off my debts and become a multi-millionaire again. Using this method in the crypto world, making money is as easy as drinking water; the crypto world is like an ATM!
If you also want to use cryptocurrency trading as a second source of income, want to get a piece of the pie in the crypto world, and are willing to spend time learning and growing, then don't miss this article. Read it carefully, every point is the essence of the crypto world.
Eight fundamental principles of contract trading (essential for beginners)
1. The risk of each transaction should never exceed 10% of the trading capital. For beginners, it is recommended to keep it between 2% and 5%.
2. Once you enter the market, never close your position blindly due to a lack of patience. Market trends take time to develop, and you must have sufficient confidence and patience until the market proves your actions wrong.
3. It must be executed according to plan, and excessive trading is strictly prohibited.
4. Once a trade is successful and a profit is made, adjust your stop-loss and take-profit levels as a safeguard, and boldly pursue even greater profits until the trend changes.
5. Once you enter the market, you should not arbitrarily cancel your stop-loss order. This means that once you enter the market, your entire trading process is a risk control process, so you must set up protection after entering the market and never trade without any protection.
6. Avoid adding costs after a successful transaction, i.e., avoid adding to your position.
7. You cannot easily switch from a long position to a short position; this is a highly skilled operation.
8. When you are doing well in trading, avoid adding to your position at will. The probability of making a mistake is very high at this time because you have become complacent.
What truly helped me was this set of indicators (MA moving average) that I developed through over ten years of cryptocurrency trading, repeatedly testing and growing my portfolio from 700,000 to over 28 million. It's simple, easy to understand, and perfect for cryptocurrency beginners. You must read this article; you will benefit from it for life and avoid at least 10 years of pitfalls!
Moving averages are one of the most common and fundamental analytical indicators, reflecting changes in average cost over a period of time. Moving averages and moving average systems formed by multiple moving averages are often used to judge market trends. Under certain conditions, moving averages can function as support and resistance levels.
I. Definition of Moving Average (MA)
(Moving average), also known as the moving average line, is a technical analysis method based on Dow Jones' "average cost concept." It uses the statistical principle of "moving average" to connect the average prices of products over a period of time into a curve, displaying historical price fluctuations and reflecting future price trends. It is a visual representation of Dow Theory.
II. Calculation Method of Moving Average
The moving average (MA) is calculated by taking the arithmetic average of the closing prices over a consecutive number of days. The number of days is the parameter of the MA. In the field of technical analysis, the moving average is an indispensable indicator tool. The moving average utilizes the statistical principle of "moving average" to calculate a trend value by averaging the daily market prices, which is then used as a tool to judge price trends.
Calculation formula: MA = (C1 + C2 + C3 + C4 + C5 + ... + Cn) / n, where C is the closing price and n is the moving average period. For example, the 5-day moving average price of Bitcoin is calculated as: MA5 = (closing prices of the previous four days + closing prices of the previous three days + yesterday's closing price + today's closing price) / 5
Moving averages can be divided into three types based on their time period: short-term moving averages, medium-term moving averages, and long-term moving averages. Short-term moving averages are generally calculated using a period of 5 or 10 days; medium-term moving averages are mostly calculated using a period of 30 or 60 days; and long-term moving averages are mostly calculated using a period of 100 or 200 days.
III. Periodic Chart of Moving Averages (MA)
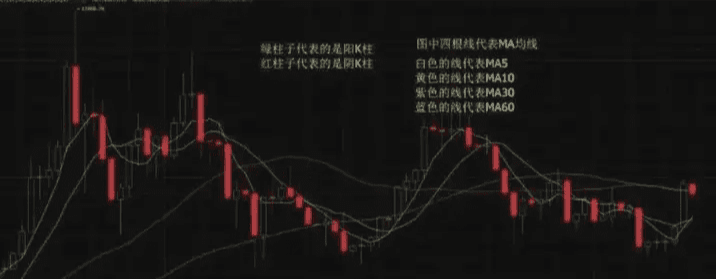
When used with a timeframe chart, MA represents a multiple of the average value. For example, on a one-hour chart, MA5 represents the 5-hour average, while MA10, MA30, and MA60 represent the corresponding values. On a four-hour chart, MA5 represents 5 times the 4-hour average, and MA10, MA30, and MA60 correspond to 10, 30, and 60 times the 4-hour average, respectively. MA moving averages are most commonly used on daily charts, so MA5, MA10, MA30, and MA60 correspond to the 5-day, 10-day, 30-day, and 60-day moving averages, respectively. Note: When using the MA moving average indicator, the value after MA can be set according to your preference, such as MA5, MA10, MA20, MA30, and MA40. The most commonly used are usually the four moving averages MA5, MA10, MA30, and MA60, which I will explain below.
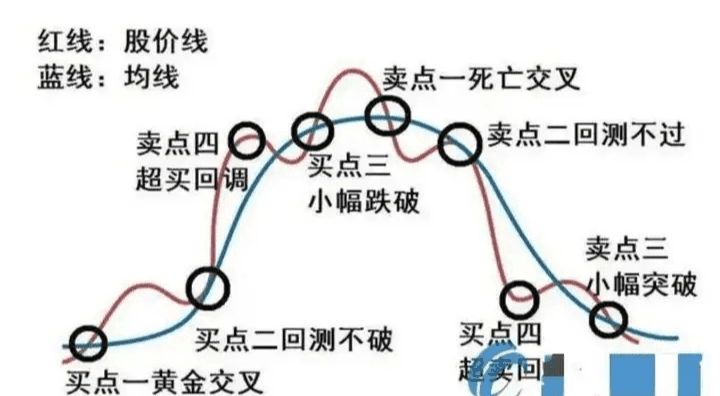
IV. The significance of moving averages (MA) and Granville's Eight Rules:
1. When the moving average gradually changes from a downward trend to a sideways upward trend, and the price breaks through the moving average from below, it is a bullish signal.
2. Although the price falls below the average line, it immediately rebounds back above the average line. At this time, the average line continues to rise, which is still a bullish signal.
3. When the price trend is above the average line, and the price falls but does not break below the average line and immediately reverses upward, it is also a bullish signal.
4. If prices suddenly plummet, falling below the average line and far from it, there is a possibility of a rebound after the extreme drop, which is also a short-term buying opportunity.
5. When the moving average gradually changes from an upward trend to a sideways or downward trend, and the price breaks below the moving average, it is a bearish signal.
6. Although the price breaks through the moving average upwards, it immediately falls back below the moving average. At this time, the moving average continues to decline, which is still a bearish signal.
7. When the price trend is below the average line, and the price rises but fails to break through the average line and immediately reverses and falls, it is also a bearish signal.
8. If prices suddenly surge, break through the average line, and move far away from the average line, there is a possibility of a pullback after the surge, which presents a short-term shorting opportunity.
Memorizing Granville's Law is not difficult as long as you grasp the concepts of support and pressure.
V. Characteristics and Key Points of MA
As mentioned earlier, moving averages (MA) can be divided into three types based on their time frame: short-term, medium-term, and long-term. If the price is below the 200-day moving average, it indicates a bear market; conversely, it indicates a bull market.
(1) The basic idea of MA is to eliminate the influence of random fluctuations in market prices and seek the trend of price fluctuations. It has the following characteristics:
1: Follow the trend. The moving average (MA) can indicate the direction of price trends and track these trends.
2. Lagging effect. When the original price trend reverses, the moving average (MA) moves slowly, and its reversal speed lags behind the major trend.
3. Stability. The MA (Moving Average) lags behind price movements because it is the average of price changes over several days.
4. Reinforcing or amplifying effect: When the market price breaks through the moving average, price fluctuations tend to continue in the direction of the breakout.
5. Characteristics of Support and Resistance Lines. Moving averages (MA) act as support and resistance lines in price movements. The parameters of a MA essentially adjust these characteristics. The larger the parameter value, the stronger these characteristics become.
(2) Shortcomings:
1. Moving averages cannot react promptly to sudden market changes and exhibit a lag in response.
2: Moving averages often exhibit deceptive price movements. To overcome these shortcomings, it is necessary to combine them with other technical methods.
(3) Application rules of MA. The most common one is Granville's "Eight Rules for Buying and Selling with Moving Averages".
VI. Common Trends of Moving Averages and the Market Trends They Indicate (Taking Daily Chart as an Example)
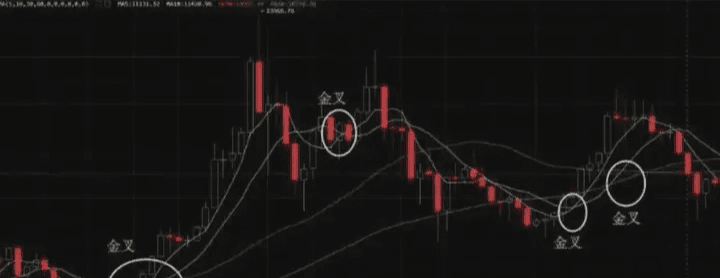
1. Golden Cross Pattern +:
In the early stages of an uptrend, a crossover where the short-term moving average breaks through the medium- to long-term moving average from below is called a golden cross. This indicates an impending price increase: A golden cross is generally formed when the short-term 5-day moving average (MA5) crosses above the short-term 10-day moving average (MA10) (yellow line). A golden cross is also formed when the short-term 10-day moving average (yellow line) crosses below the medium-term 30-day/60-day moving averages (MA30/MA60) (purple/blue lines).
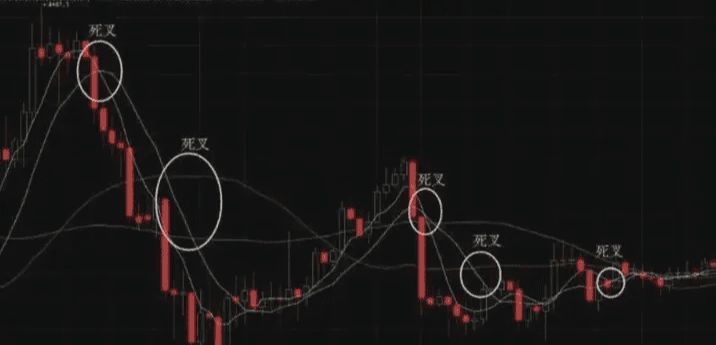
2 Death Cross Pattern+:
A death cross occurs when a short-term moving average crosses below a medium- to long-term moving average. This indicates a potential price decline: a death cross occurs when the short-term 5-day moving average (MA5, white line) crosses below the short-term 10-day moving average (MA10, yellow line). A death cross also occurs when the short-term 10-day moving average (MA10, yellow line) crosses below the medium-term 30-day/60-day moving averages (MA30/MA60, purple/blue lines).
3. Multiple uptrends +:
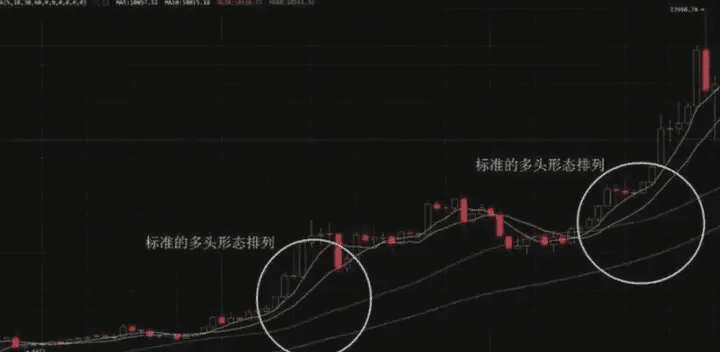
When an upward trend enters a stable phase, the 5-day, 10-day, 30-day, and 60-day moving averages are arranged sequentially from top to bottom, moving upwards to the right; this is called a bullish alignment. It indicates a significant price increase. From top to bottom, a bullish moving average alignment consists of the short-term 5-day moving average (white line), the short-term 10-day moving average (yellow line), the medium-term 30-day moving average (purple line), and the medium-term 60-day moving average (blue line). This bullish alignment signifies an upward price trend.
4. Bearish alignment +:
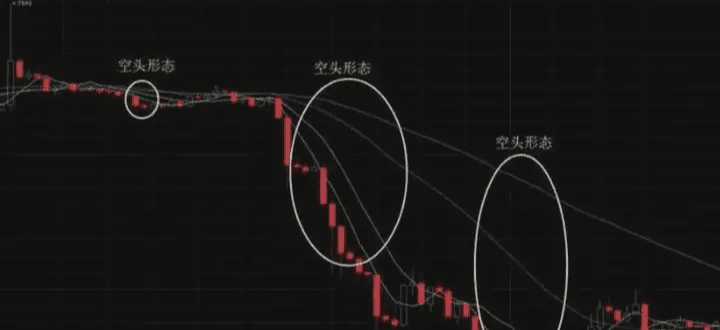
In a downtrend, when the 5-day, 10-day, 30-day, and 60-day moving averages are arranged sequentially from bottom to top and move downwards to the right, this is called a bearish alignment. It indicates a significant drop in stock price. From bottom to top, a structure formed by the short-term MA5 (daily), short-term MA10 (yellow line), medium-term MA30 (purple line), and medium-term MA60 (blue line) moving averages arranged side-by-side downwards is also a bearish moving average alignment! A bearish alignment represents a downward price trend!
5. In an uptrend, the price is above the moving averages, and the moving averages arranged in a bullish pattern can be seen as the defense line for the bulls. When the price retraces to the vicinity of the moving averages, each moving average provides support in turn, and buying funds enter the market to push the price up again. This is the supporting effect of the moving averages.
6: In a downtrend, when the price is below the moving average, the moving averages arranged in a bearish pattern can be seen as the bears' defense line. When the price rebounds to the vicinity of the moving average, it will encounter resistance, and selling pressure will emerge, causing the price to fall further. This is the bearish effect of the moving average.
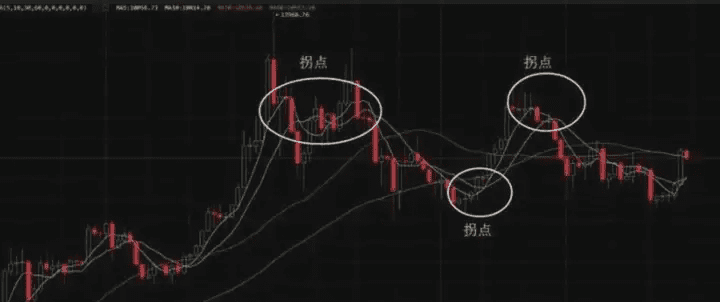
7: The turning points of a moving average are when it changes from an upward trend to a downward trend and reaches its highest point, and when it changes from a downward trend to an upward trend and reaches its lowest point. These are indicative of a potential reversal in price trends.
With the principle of seeing things through to the end, I'll teach you how to develop profitable investment habits in 21 days and how to build your own trading system!
Creating a system isn't difficult. The difficulty lies in following the rules you establish when creating the system.
The goal of a trading system
When you build your system, you need to achieve two very important goals:
1. Your system should be able to identify trends as early as possible.
2. Your system must be able to prevent you from suffering losses in both directions.
If your trading system can achieve the above two points, your chances of success will increase.
These goals are difficult to achieve because they are contradictory.
If you have a system that is characterized by its ability to quickly capture trends, then you are very likely to be capturing false trends.
On the other hand, if your system emphasizes avoiding losses, you may act late in trading or miss many opportunities.
When designing a mechanical system, your task is to find a compromise between these two objectives. Try to identify the trend as quickly as possible, while distinguishing between false and true trends.
Six Steps to Develop a Trading System
From a long-term perspective, a good trading system can potentially help you make a lot of money.
Step 1: Timeframe
When developing a trading system, the first thing you need to determine is what type of trader you are.
Are you a day trader or a swing trader? Do you look at charts daily, weekly, monthly, or yearly? How long do you plan to hold your positions?
This will help you determine the timeframe you use for trading. Even if you look at charts with multiple timeframes, this will determine the primary timeframe you use to identify trading signals.
Step 2: Find indicators to help you identify new trends
Since your goal is to identify the trend as early as possible, we need to use indicators that can achieve this goal. Moving averages are one of the most popular indicators among traders for determining trends.
Use two moving averages (one fast and one slow), and then wait until the faster one crosses the slower one or moves below it. This is the basis of the "moving average convergence" system.
The simplest form of the moving average convergence system is the fastest way to identify new trends. It is also the simplest method to discover new trends.
Of course, traders have many other methods to identify trends, but moving averages are one of the easiest tools to use.
Step 3: Find indicators that help you identify this trend.
The second objective of our trading system is to avoid double losses, meaning we don't want to get trapped in the wrong trend. Our method for avoiding double losses is to use other indicators to confirm whether a new trend signal is true or false when we identify it.
There are many indicators that can be used to confirm trends, but we prefer the Moving Average Convergence Divergence (MAD), Stochastic Oscillator, and Relative Strength Index (RSI). As you become more familiar with the variety of indicators, you can find your favorites and incorporate them into your system.
Step 4: Define your risks
When creating a trading system, it is crucial to determine the amount of loss you can tolerate for each trade. Few people are willing to discuss the issue of loss, but in fact, good traders consider how much loss they are willing to accept before thinking about how much money they can make.
The amount of loss you're willing to tolerate will differ from others. You need to determine how much breathing room your trading requires, and avoid taking too much risk on any single trade. In later lessons, you will learn about money management. Money management has a significant impact on how much risk you take in each trade.
Step 5: Clarify entry and exit points
Once you've determined the amount of loss you're willing to accept in a trade, the next step is to find out where you can enter/exit to maximize your profits.
Some traders like to enter a trade immediately when their indicators align and give a good signal, even before the candlestick has closed. Others, however, wait until the candlestick closes before entering a trade.
One trader stated that he believes waiting until the candlestick closes before entering a trade is the best option. He has repeatedly entered trades before the candlestick closes, when all indicators align, only to find that the trades turn out completely contrary to his expectations by the close.
It's simply a matter of trading style. Some traders are more aggressive, and eventually you'll discover what kind of trader you are.
Regarding exiting the market, you have a few options. You can move your stop loss by moving it by X points if the price moves X points in your favor.
Another approach is to set a fixed target and exit the position when the price reaches that target. How you calculate your target price is up to you. Some people choose to use support and resistance levels as their targets.
Some people set the same number of points for every trade. No matter how you calculate your target, make sure you stick to it. Don't exit the market first, no matter what happens. Stick to your system! After all, you created it.
Another way to exit is to have a set of criteria, and you exit when those criteria are met. For example, if your indicator retraces to a certain level, you exit.
Step 6: Write down the rules of your trading system and follow them.
These are essential qualities that every trader must possess; therefore, you must act according to your trading system. If you don't follow the rules, your trading system is useless, so remember to adhere to the principles.
Didn't we tell you to stick to your principles?
How to test your trading system
The quickest way to test your trading system is to find a charting platform that allows you to backtrack to past price movements and move candlesticks one by one. Trade according to your system each time you move a candlestick forward.
Record your trading system honestly! Record your profits, losses, average profits, and average losses. If you are satisfied with the results, you can start the next round of testing: live trading with a demo account.
Trade with your system on a demo account for at least two months. This will give you an understanding of how you should use your system to trade when the market changes. Trust us, there's a big difference between live trading and backtesting.
After trading on a demo account for two months, you'll know if your system can hold its own in the market. If you're still getting good results, then you can choose to start trading with a live account.
However, you must have complete confidence in your trading system and be able to trade without hesitation.
I'm sharing these eight ironclad rules that I strictly adhere to in the crypto world, without reservation, with you guys. I hope you can all get out of this mess soon and live the life you desire!
Rule 1: Stay away from altcoins; stay away from fraudulent and shady platforms!
Article 2: Use spare money to trade cryptocurrencies, without loans or leverage, to avoid being fully invested and missing out on potential gains, which could lead to catastrophic losses!
Article 3: Protect your principal and do not chase rising prices, lest you get trapped at the peak and eat dirt every day. In 2018, the cryptocurrency market is not short of opportunities to get rich quickly, and people are racing everywhere. Don't be afraid of missing the opportunity to get on board!
Rule 4: Don't look at any negative or bad news in the group. It's all just the big players scaring you into selling your shares at a loss so they can take over!
Article 5: As long as it is a high-quality coin that you have chosen, maintain your faith in it, hold it for the long term, and don't scare yourself into selling at a loss all the time!
Article 6: Thoroughly study cryptocurrency and blockchain knowledge, and don't rush into the market before you understand the principles!
Article 7: Enrich your spare time and cultivate some hobbies. Besides cryptocurrency trading, there are many wonderful things in life worth spending time learning!
Article 8: If you are trapped at a high price, please maintain your faith and hold for the long term! Don't sell at a loss casually! As long as the coins are there, the dream is there!

We are YiYan, specializing in cryptocurrency education for 7 years.

A single log cannot make a boat, and a lone sail cannot go far! In the crypto world, if you don't have a good network or access to the latest crypto news, then I suggest you join me. There are still spots available in my team, so come quickly! Welcome to join us!!! $BTC $ETH