

But the cryptocurrency world is truly amazing. By chance, I received guidance from a master. On a stormy night, I realized the true path and started trading full-time from scratch, becoming a professional trader. I diligently studied the techniques, working hard day and night, and eventually formed my own stable profit system!
The journey in the cryptocurrency world is long and winding. I hope everyone takes fewer detours and experiences fewer tragedies! As someone who has achieved financial freedom, I continue to create content on Zhihu. In fact, many people do not understand why, after achieving financial freedom and hitting a few small goals, I still want to do this.
I have also asked myself the same question; in the process of finding back my original intention, on one hand, it’s for my dream of English promotion, everything I have is
Dedicated to trading, honing exceptional skills without wanting to be unknown or unrecognized!
On the other hand, it aims to provide a path for those eager to learn; what is gained in the market is now also a process of giving back to the market. The way of nature reminds me of how I struggled for half a year with various leverage issues, and along the way, there has been nothing to show for it.
Refer to the learning path, only focus on the candlesticks + repeatedly replaying, many days and nights, rolling and working hard to get to now, deeply aware of the difficulties of retail investors and new traders, and can empathize more!
Core four-step method: Mechanical execution, aggressive compounding.
1. Coin targeting technique. MACD golden cross + hunting: Prioritize golden crosses above the O axis on the daily level! These types of coins have strong bullish trends and a success rate of
68% (historical backtesting data), avoid the trap of bullish divergence below the zero axis.. Case: Ethereum's MACD crossing above water in April 2024.
After the cross, a 40% surge over 3 weeks, outperforming the broader market by 2 times!
2. Moving average life and death line*. Aggressively operate above the line, cut hands below: Price stabilizing above the 20-day moving average = attack signal, falling below = unconditional liquidation! This line
The line is the boundary between bulls and bears; breaking it means that the main force has retreated; don’t fall in love with the trend!
3. Position art. Full position charge conditions: Price + volume is a double breakthrough moving average (e.g., BTC breaking through $60,000 with volume), otherwise only use
50% position for testing... Take profit secrets: Harvest 1/3 of 40% profit, cut another 1/3 at 80%, let the remaining position run for profit, but if it falls below the average
Immediately hit the button to close positions!
4. Stop-loss is as essential as breathing. Cut when the line breaks! Even if there’s a V-shaped rebound the next day, don’t regret it; discipline is 100 times more important than single trade profits and losses! Historically
87% of liquidations stem from 'waiting a bit longer' (data source: the blood and tears history of coins).
Three don'ts: Avoid the three major fatal actions.
1. Refuse to chase highs: Rising # opportunities may be bait for traps! Wait for a pullback to the moving average or a second golden cross of MACD before acting.
2. Refuse to go all in: Betting everything on one coin = handing your life over to the market maker; at least diversify into 3-5 different coins (mainstream + potential small coins).
3. Refuse to go all in: Keep 30% cash; buy on sharp dips and add on sharp rises to always maintain the initiative!
Six sayings: Understand the market language and harvest from the major players.
1. High position sideways hides danger, low position grinds the bottom waiting to take off—horizontal length indicates how tall!
2. I won't accompany the sideways dead; the breakthrough direction reveals the truth—80% of losses come from careless operations!
3. Selling on bearish volume and buying on bullish volume—go against emotions and only eat panic orders!
4. Don’t catch falling knives; wait for rebounds on slow declines—sharp drops must have pullbacks, while slow declines may reach new lows!
5. Sell more as the price rises, buy more as the price falls—pyramid building costs lower than institutional players!
6. After sharp rises and falls, consolidation is the destination—don’t guess tops and bottoms, wait for the market to choose its direction!
Ultimate mindset: Crush the market with discipline · Data speaks: Backtesting from 2024-2025 shows that adhering to the four-step method + mnemonic for investment
Investors have an average return rate of over 300%, outperforming 99% of 'feeling flow' players.
Anti-human behavior: When you want to 'wait a bit longer', immediately execute the strategy; when you want to 'take a gamble', immediately close the exchange!
Surviving is the future: One day in the crypto market equals a year in the human world. It’s better to miss 10 opportunities than to fall into a deep pit once!
(Warning: The only reason all strategies fail—do not! Execute!) Remember: The strategy is the sword, discipline is the shield, if the inner demon is not eliminated,
Liquidation is on the way!
An essential tool for retail traders to identify trends: structural breakthrough* (BOS) strategy analysis.
In trading, a 'structural breakthrough' refers to the price breaking through established highs and lows in a trend, clearly indicating the holding of the current direction.
Continues the flow of orders. This concept is crucial in trend analysis, helping traders understand market momentum and potential future directions.
In simple terms, it is the process of forming higher highs (HH) in an uptrend, rather than first forming lower lows (LL).
This situation is known as a bull market structural breakthrough. In a downtrend, structural breakthroughs occur when lower lows are formed first, followed by higher highs.
The high point, which is known as a bear market structural breakthrough. In other words, the structural breakthrough signal indicates the continuation of market momentum or market sentiment.
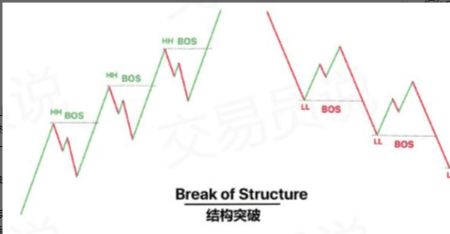
Order is important. A structural breakthrough only counts when a higher high is formed without first breaking the low in an uptrend. In a downtrend,
In a downtrend, a structural breakthrough only counts when the price forms lower lows before breaking through the recent highs. If an uptrend occurs
If either of the two situations is described, we can consider it a market structure transition* (MSS) or characteristic change (ChoCh).
Essentially, a structural breakthrough means you have received the first signal indicating that the existing trend is weakening and a reversal is imminent.
It should be noted that structural breakthroughs do not only occur in trending markets. When the price breaks through key support or resistance levels, established
Trend lines, and even certain chart patterns, can also be considered structural breakthroughs.
Any occurrence of structural breakthroughs in the market can be seen as a structural breakthrough. However, in this article, we will focus on describing them in trending markets.
Market structure breakthroughs.
In this article, we will delve deep into structural breakthroughs as this is the most basic concept in smart money trading.
Basic market structure.
Market structure refers to the way prices change over time. There are three main types:
1. Uptrend: When the price continuously rises, you will see new highs being created, and the price will not fall below previous lows.
2. Downtrend: Opposite to the uptrend, the price continuously falls, creating new lows and will not break through previous highs.
3. Range-Bound: In this case, the price fluctuates within a certain range but does not create new highs or new lows.
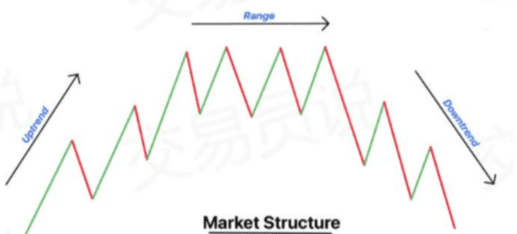
The concept of 'structural breakthrough' is actually only meaningful in uptrends and downtrends. It occurs when the price breaks through significant highs in an uptrend or significant lows in a downtrend. This is a signal indicating strong trends that may continue. However, in a range-bound market, prices do not create new highs or new lows, so structural breakthroughs do not apply.
Types of structural breakthroughs.
Based on direction and breakthrough conditions, there are two types of structural breakthroughs:
Bull market structural breakthrough (Bull BoS):
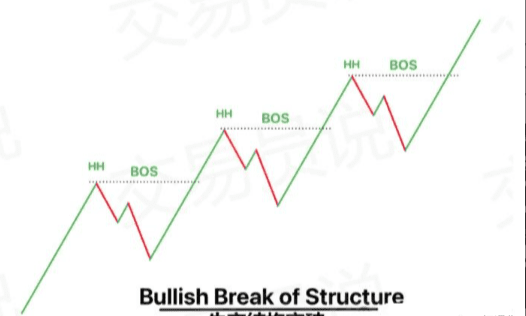
When the price breaks through the swing highs in a trend, it indicates strong upward momentum and suggests that the bull market (uptrend) may continue.
Bear market structural breakthrough (Bear BoS):
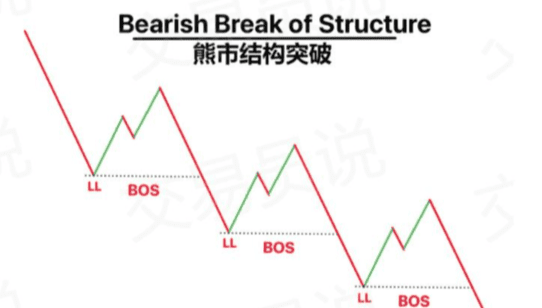
Conversely, when the price breaks through swing lows, it indicates strong downward momentum and may suggest that the bear market (downtrend) will continue.
The difference between structural breakthroughs in bull and bear markets
The lower image distinguishes between bull market structural breakthroughs and bear market structural breakthroughs:

Significance.
'Structural breakthroughs' help predict whether the market will continue its existing trend or reverse direction. This insight has several aspects.
Importance:
1. Predicting market direction:
By identifying structural breakthroughs, traders can anticipate whether the current trend will continue or if the market is about to reverse. This kind of reasoning
Their strategies can align with the potential future trends of the market.
2. Collaborate with market makers for trading:
Identifying confirmed structural breakthroughs enables traders to align their trades with market makers' operations. When a structural breakthrough confirms trend continuation
In this way, traders can more easily and confidently trade in that direction.
3. Grasp the timing of entry and exit:
Structural breakthroughs can also serve as important signals for grasping market entry and exit timing. For example, a bull market structural breakthrough indicates an upward trend.
Good entry points, while bear market structural breakthroughs may represent favorable timing for exiting or establishing short positions.
Break of structure Example
Examples of structural breakthroughs
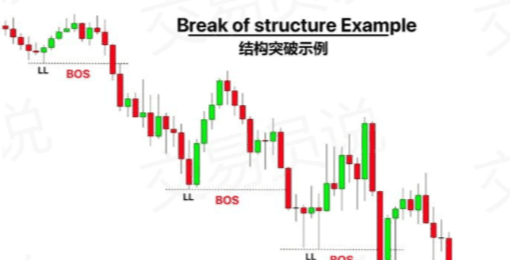
Overall, understanding and utilizing structural breakthroughs can not only enhance the ability to predict market trends but also align trading strategies with market momentum.
The powerful force of momentum aligns with this, increasing the potential for successful trades.
How to apply structural breakthroughs in trading?
Effectively trading structural breakthroughs requires combining them with other strategies to improve the accuracy of predicting future price directions. Here is a simple
The explanation shows how to combine structural breakthroughs with moving averages and candlestick pattern strategies:
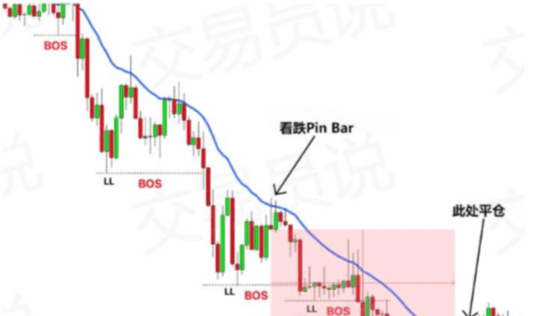
1. Set.
First, identify lower lows and lower highs in a downtrend. Add a 21-period exponential moving average (EMA) to the chart.
2. Identify structural breakthroughs.
A structural breakthrough occurs when the price breaks below these lower lows. This indicates that the price may continue to move downward.
3. Execute sell trades.
After a bearish structural breakthrough occurs, wait for a bearish candlestick pattern to form, such as a bearish engulfing pattern or a PinBar. This is your signal to enter a sell trade.
4. End trading.
Monitor the relationship between price and EMA. When the price breaks through the EMA, it means that the trend may change or momentum may be lost, at which point you can close positions.
Remember, this strategy is just an example to help you understand how to incorporate structural breakthroughs into trading. It is important to base it on your
Develop and test your own strategies based on your trading style and risk tolerance. Incorporating structural breakthroughs as part of a broader strategy can
Enhance the effectiveness of trading by providing additional confirmation of market trends.
Case Study: Trading using bull market structural breakthroughs and demand zones+
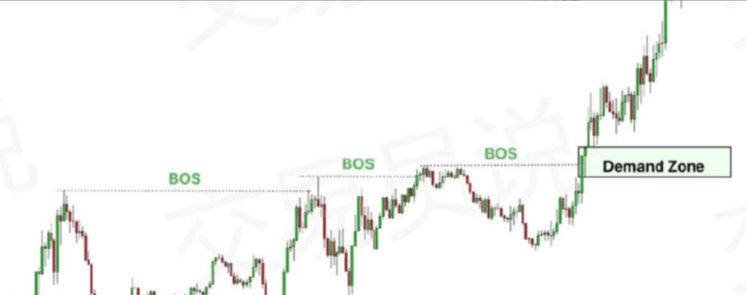
In this trade, we observed a clear bull market structural breakthrough (Bull BoS) in the market. When the price broke through the previous heavy
indication of strong upward momentum.
Identification of bull market BoS:
The market shows an uptrend, creating higher highs and higher lows.
When the price breaks through recent highs, it confirms the bull market BoS, indicating that the upward trend may continue.
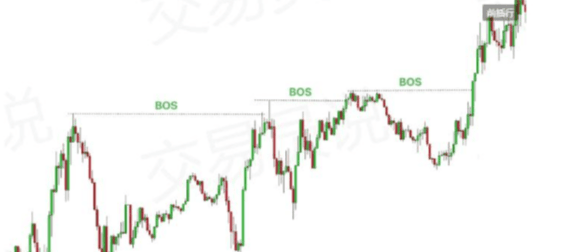
Formation of demand zones:
After the formation of BoS in a bull market, the price retraces to the breakout area, forming what is known as the demand zone.
This demand zone is located near the area where BoS occurred, making it a key level for potential order accumulation.
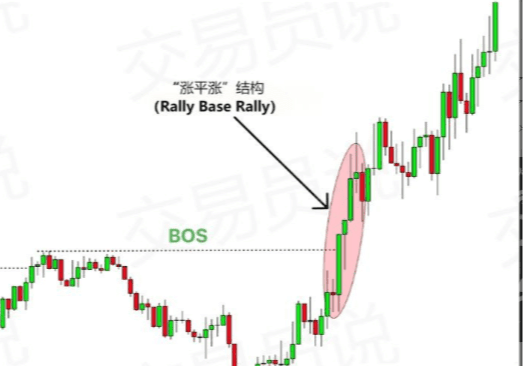
Trade execution:
Observe the price trend and wait for the price to return to this demand zone.
As expected, the price entered the demand zone and began to show signs of order accumulation. This is my signal to prepare for a buy trade.
Trading results:
After filling orders in the demand zone, the price begins to fluctuate upwards.
This volatility confirmed my analysis, and I
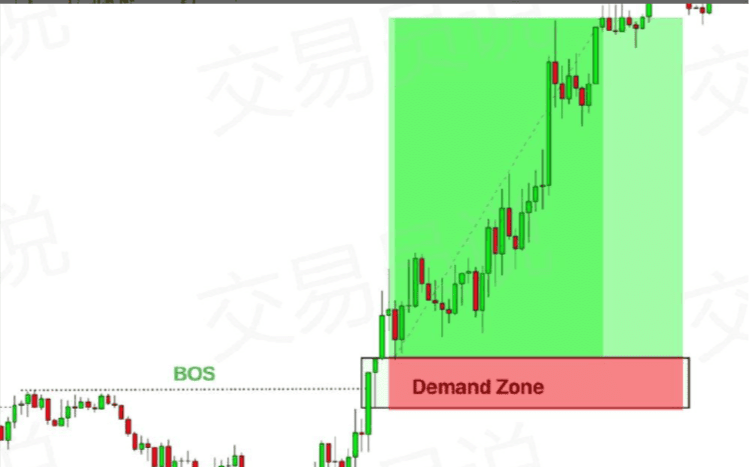
A buy trade was made under strong upward momentum.
This trade offers a high risk-reward ratio because the entry point in the demand zone provides a clear stop-loss level, and due to the confirmed upward trend, there is also considerable potential for upward movement.
How to operate structural breakthroughs in forex trading?
In a bull market, when the price breaks through the structure, you should mark the inducement zone + (in price action trading, inducement is a trap for smart money, which can take the form of order blocks, supply and demand zones, or support and resistance zones), and wait for the price to retrace to that zone and rebound.
When the price touches the inducement zone, you can look for confirmation signals for buy trades in a lower time frame, such as market structure transitions (MSS) or trend reversals.
In a bear market, when the market breaks through structure, you should mark the inducement zone and wait for the price to retrace to that zone and rebound.
When the price touches the inducement zone, you can look for confirmation signals for sell trades in a lower time frame, such as market structure transitions (MSS) or trend reversals.
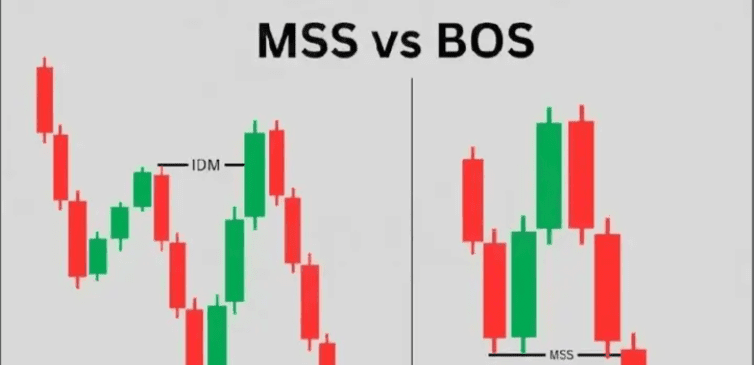
As we discussed earlier, the structural breakthrough indicates that after breaking through the inducement zone, the previous structure (highs/lows) has been broken.
The ICT market structure transition (MSS) indicates a break of swing lows or swing highs.
Thus, the difference between structural breakthroughs and market structure transitions lies only in the inducement zone.
Structural breakthroughs indicate significant changes in price trends, while market structure transitions indicate preliminary changes in structure.
You can refer to the chart below to understand the difference between BoS and MSS:
Conclusion.
Overall, 'structural breakthrough' is a very important concept in price action trading. It helps us judge whether the market will continue
Continued upward or downward. We understand that combining structural breakthroughs with other tools (such as demand zones or candlestick patterns) can make our trading strategies more effective.
Remember, structural breakthroughs are a great guide, but they work best when used in conjunction with your own trading plan. The key is to better understand the market and make more informed trading decisions. By continuously practicing this concept, you will master how to leverage it to your advantage in trading.
When using structural breakthrough strategies for trading, we must remember that no strategy is foolproof, so we should not invest all account funds into this strategy.
Additionally, to reduce risk, you should always set stop losses to protect your principal.

Share some small tips for trading cryptocurrency: Don’t short in a bull market, and don’t long in a bear market; don’t sell on dips in a bull market, and don’t chase highs in a bear market.
1. Buying relies on patience, selling relies on determination, holding relies on confidence.
2. Buy on small dips in an uptrend; sell on small rises in a downtrend.
3. Buy in portions, don’t lose money; buy all at once, lose more money.
4. Support levels that are held for too long will inevitably fail, and resistance levels that are attacked for too long will inevitably break.
5. Both bears and bulls can earn, only the greedy do not earn.
6. Eat until 80% full, trade to earn 80%.
Playing around in cryptocurrencies is basically a battle between retail investors and institutional players. If you don’t have super strong professional skills, you can only be cut! If you want to layout together and harvest from the institutional players, you can come, and follow A Xun to see real trading for learning and communication, where you can also understand the market direction and strategy clearly. No matter what style the market is, knowing it in advance gives you time to master it better!!!
The team still has spots available, follow A Xun to become an institutional player and also a winner. $BTC $ETH