$GMX/USDT Analysis
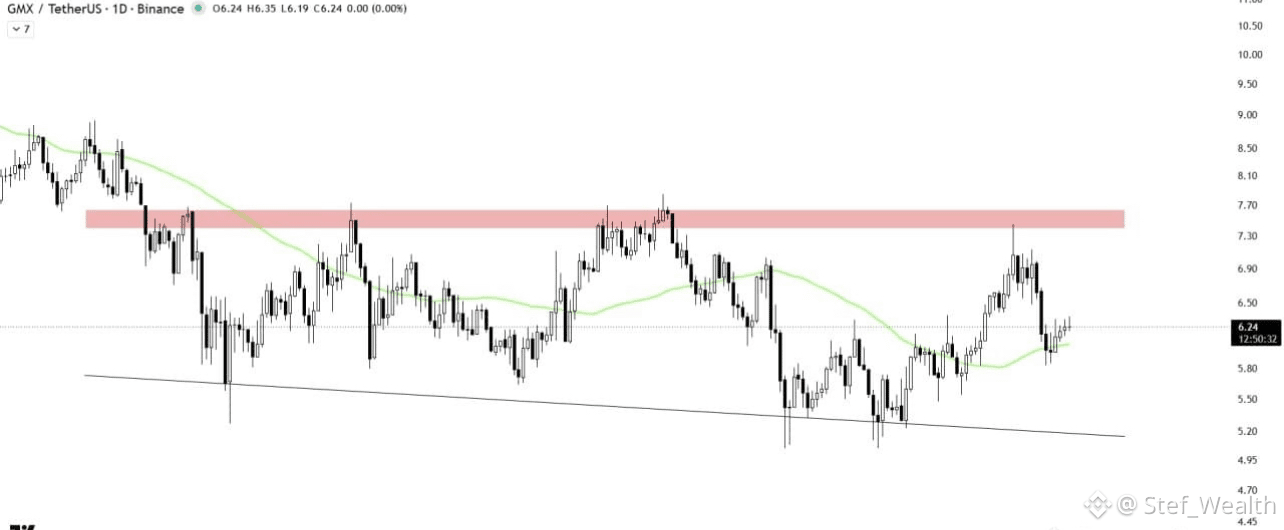
$GMX continues to respect its 50-day Moving Average, which has now flipped into dynamic support after the recent recovery.
The chart also shows a series of higher lows developing from the long-term ascending trendline, suggesting buyers are gradually regaining control despite repeated pullbacks.
The major obstacle remains the horizontal resistance zone around $7.30–$7.60, a level that has rejected price multiple times over the past several months.
For now, GMX is compressing between trendline support and overhead resistance. The longer price builds beneath resistance while holding key support, the more significant the eventual breakout could become.
GMX is approaching a decision point.
#GMXUSDT #market
$GMX continues to respect its 50-day Moving Average, which has now flipped into dynamic support after the recent recovery.
The chart also shows a series of higher lows developing from the long-term ascending trendline, suggesting buyers are gradually regaining control despite repeated pullbacks.
The major obstacle remains the horizontal resistance zone around $7.30–$7.60, a level that has rejected price multiple times over the past several months.
For now, GMX is compressing between trendline support and overhead resistance. The longer price builds beneath resistance while holding key support, the more significant the eventual breakout could become.
GMX is approaching a decision point.
#GMXUSDT #market