
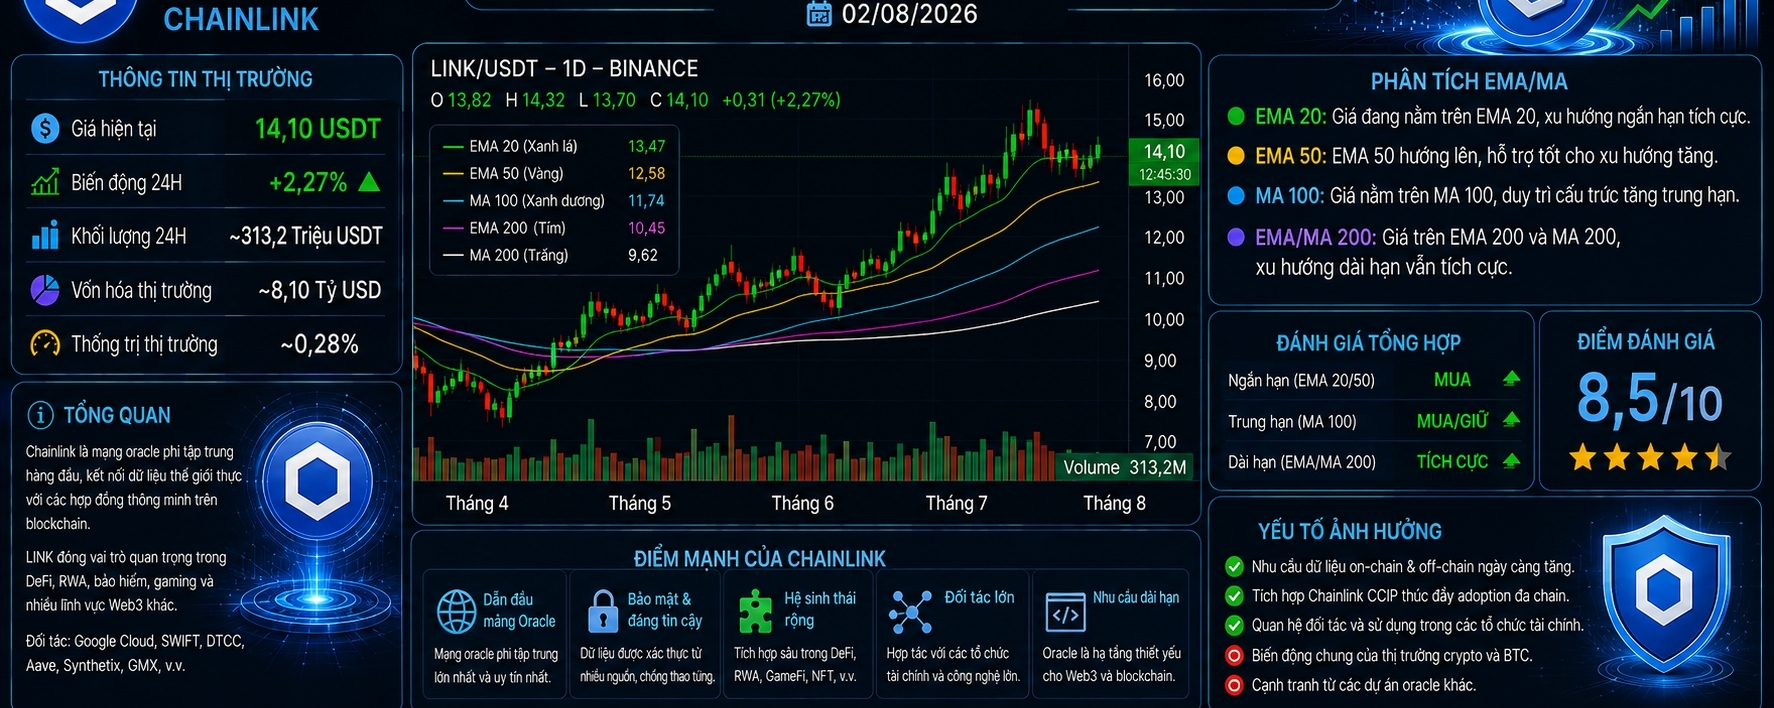

Currently, the EMA/MA of $LINK (Chainlink) is giving a positive signal, but it is not yet a fully strong uptrend.
EMA/MA analysis
🟢 EMA 20: LINK price is above the EMA 20, indicating that short-term upward momentum is still maintained.
🟢 EMA 50: The EMA 50 is trending upward and acts as an important support zone. If the price continues to hold above the EMA 50, the short-term uptrend will be further strengthened.
🟡 MA 100: Price is nearing or testing the MA 100. A decisive breakout above this level would be a more positive signal for the medium term.
🟡 EMA/MA 200: This is still an important resistance zone. If LINK breaks above and holds above the EMA/MA 200, the long-term uptrend will be confirmed.
Overall assessment $LINK
🟢 Short term (EMA 20/50): BUY
🟡 Medium term (MA 100): HOLD & WATCH
🟡 Long term (EMA/MA 200): Wait for confirmation
Rating point
8/10
Assessment:
LINK currently has a positive technical structure in the short term.
If the price continues to hold above the EMA 20 and EMA 50 while also breaking above the EMA/MA 200 with increasing trading volume, the likelihood of forming a sustainable uptrend will be higher.
On the contrary, if the price loses the EMA 50, the risk of a short-term correction will increase, and you need to watch additional signals from trading volume and the RSI before making a decision.#SpaceXFirstLockupExpiresAug6 #TheoDõiFOMC #USIranDealOrNoDeal $LINK