

As a seasoned full-time cryptocurrency trader, I have adhered to the ten unbreakable rules of the crypto circle for the past decade. These rules, even when studied repeatedly a thousand times, never cease to captivate me; instead, I increasingly feel the need to engrain them deeply in my heart.
Looking back on the first three years of my journey in the crypto world, I entered the market with a capital of two hundred thousand, only to unfortunately suffer a heavy blow, with my funds shrinking to just ten thousand. Friends and family urged me to give up; they believed my trading in cryptocurrencies was no different from gambling, a manifestation of selfishness, lack of responsibility, and a failure to strive for progress. Those harsh words pierced my heart like needles, leaving me disheartened and even beginning to doubt myself.
However, the stubbornness in my heart has not extinguished. I made a vow to my family to use the remaining ten thousand to challenge myself once more! So, I immersed myself deeper in studying the market. Unexpectedly, it was this ten thousand that miraculously accumulated to 75.6 million in wealth over the next three years!
I am not exaggerating; when you truly find a trading strategy that suits you and execute it unwaveringly, you absolutely have the ability to turn the tide and achieve a reversal in your life!
Williams %R (Williams Indicator) was developed by the famous trader Larry Williams. He has named several technical indicators. Today, we will focus on the Williams %R trading strategy, as well as the calculation method and practical application of this indicator.
There is no doubt that Williams %R is indeed effective. This article will explain how to apply Williams %R to trading strategies and validate its effectiveness through backtesting. Is it useful? Our conclusion is: Williams %R performs quite well, with a win rate of 81%.
Key points:
✔ Williams %R is a momentum oscillator developed by Larry Williams, used to measure the position of the current closing price within a specific lookback period (such as 5 days or 14 days) relative to the range between the highest and lowest prices. The indicator fluctuates between 0 and -100, with values close to -20 considered overbought and close to -80 considered oversold.
✔ This indicator switches quickly between extreme values and is primarily used as a mean reversion tool — looking for reversal opportunities when prices 'deviate' too far from recent highs or lows.
✔ Calculation formula: Williams %R = ((highest price - closing price) / (highest price - lowest price)) × -100; the result ranges between 0 and -100.
✔ We backtested a simple Williams %R strategy on the S&P 500 (SPY) using different lookback periods. The results showed that shorter lookback periods (e.g., 2 days) were most effective.
✔ Example backtest results:
❍ Annualized compound return (CAGR) approximately 11.9%, while buy-and-hold strategy approximately 10.3%
❍ Market exposure approximately 22%
❍ Profit Factor approximately 2.2
❍ Maximum drawdown approximately 17%
❍ Risk-adjusted return (CAGR / exposure) approximately 52%

✔ This strategy performed well in extreme market environments such as 2008–2009 and 2020, even achieving positive returns during the stock market decline in 2022.
✔ In testing, Williams %R is not suitable for shorting strategies.
✔ We also tested a mean reversion strategy based on RSI, and the results showed that Williams %R outperformed RSI (e.g., higher CAGR).
✔ Based on this, a second indicator was added as a signal filtering condition, further enhancing performance on Nasdaq (QQQ) and SPY, with a win rate of about 81%, while maintaining good risk-adjusted returns and profit-loss ratios.
✔ The typical characteristics of these mean reversion strategies are: high win rate, but individual profits are usually smaller than individual losses.
What is the Williams %R indicator?
The full English name of the Williams indicator (Williams %R) is The Williams Percent Range; it is sometimes written as Williams %R, with the abbreviations WMSR or W%R. It was developed in 1973 by the well-known American trader Larry R. Williams.
Williams %R is a type of oscillator used to assess the range of fluctuations between the highest and lowest prices in the market over a certain time period, determining whether the current price is in the overbought or oversold zone, and looking for trading opportunities. For details, see: (How to Understand the Williams Indicator for Overbought and Oversold?)
This indicator is somewhat related to random indicators; but it measures the relationship of the closing price to the lowest price. Higher readings are considered overbought, while lower readings are considered oversold.
The following shows the performance of Williams %R on the S&P 500 under a 5-day lookback period:
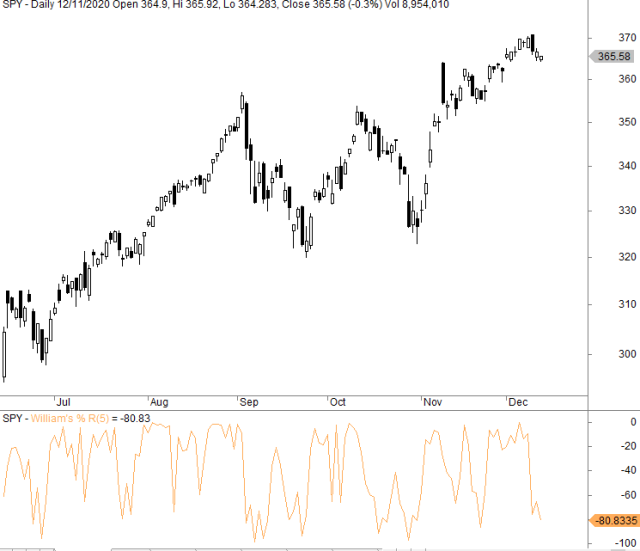
Williams %R switches very quickly between overbought and oversold areas, so it is primarily used as a mean reversion indicator.
How to calculate the Williams %R indicator?
If you use a 5-day lookback period, the formula is as follows:
Williams %R = ((highest price over the past 5 days - closing price) / (highest price over the past 5 days - lowest price over the past 5 days)) × -100
For example:
If today’s closing price is 100, the highest price over the past 5 days is 115, and the lowest price is 95, then the value of Williams %R is -75 (i.e., (15 ÷ 20) × -100).
The relationship between Williams %R and Williams Vix Fix
Williams %R is very similar to the Williams Vix Fix indicator (but in the opposite direction). The chart below shows the comparison of these two indicators under a 22-day lookback period.
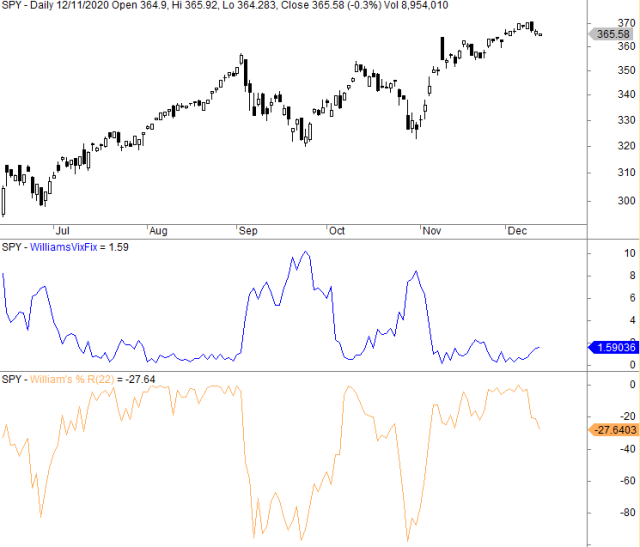
The Williams VIX Fix (WVF) indicator was born in 2007. At that time, the renowned trader and 'indicator innovator' Larry Williams wrote an article in Active Trader magazine discussing the VIX volatility index and how to create a 'synthetic VIX' for any asset you want to trade. Larry Williams' goal was to construct a usable 'synthetic VIX' reading for financial instruments beyond the S&P 500, Nasdaq, and Dow Jones 30 indices.
The purpose of the WVF indicator is to simulate the behavior of the Chicago Board Options Exchange Volatility Index (VIX) for trading instruments that do not have an options market, such as individual stocks or ETFs. WVF measures price volatility over the past 22 trading days and can serve as an alternative indicator reflecting short-term market panic or complacency.
Williams %R — Is it really effective? Backtest results say it all.
We backtested the Williams %R trading strategy on the S&P 500 (SPY), with the trading rules as follows:
The opening condition is that at the close, the Williams %R indicator is below -90; the closing condition (sell) is when the closing price of the day is above yesterday's high, or when the Williams %R close is above -30.
Through optimization testing, the results we obtained may be as expected, showing the best performance in shorter lookback periods. The shortest lookback period we used was 2 days and the longest was 25 days. Except for the 25-day lookback period (profit factor of 1.9), all tested profit factors were above 2.
The best result is a 2-day lookback period. This is shown in the equity curve below for SPY since its inception:
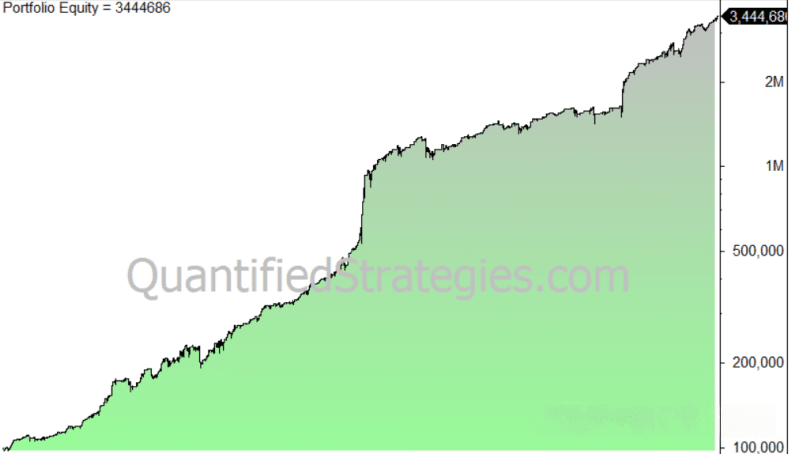
During the global financial crisis of 2008/09 and the COVID-19 pandemic in 2020, this strategy performed exceptionally well!
✍ 2008 annual return: 98.9%
✍ 2020 annual return: 43.3%
✍ Increased by 15.7% during the 2022 bear market — performance remains quite robust
The above returns are all calculated using compound interest, with the core statistics as follows:
✍ CAGR (annualized return): 11.9% (buy-and-hold is 10.3%)
✍ Market exposure: 22%
✍ Number of trades: 598 times
✍ Average return per trade: 0.6%
✍ Maximum drawdown: 17%
✍ Profit factor: 2.2
These data can be considered quite good.
If we look at the risk-adjusted return, it calculates to 52%. We derived this number by dividing the compound annual growth rate (CAGR) by the time invested in the market, which was 0.22 (22%).
Is Williams %R suitable for shorting?
Not suitable. As expected, Williams %R does not work in shorting strategies. Building a stable profit strategy in the bearish direction is much more difficult.
Williams %R vs. RSI: Which indicator is better?
Williams %R, like RSI (Relative Strength Index) and random indicators, is also a mean reversion indicator. We also tested a similar trading strategy based on RSI that closely resembles our previous tests on the Williams indicator:
❍ Open a position when the RSI is below 10 for two days at the closing price.
❍ Close the position when the closing price of the day is above yesterday's high, or when the two-day RSI closes above 70.
These conditions form the following equity curve for SPY since its inception:
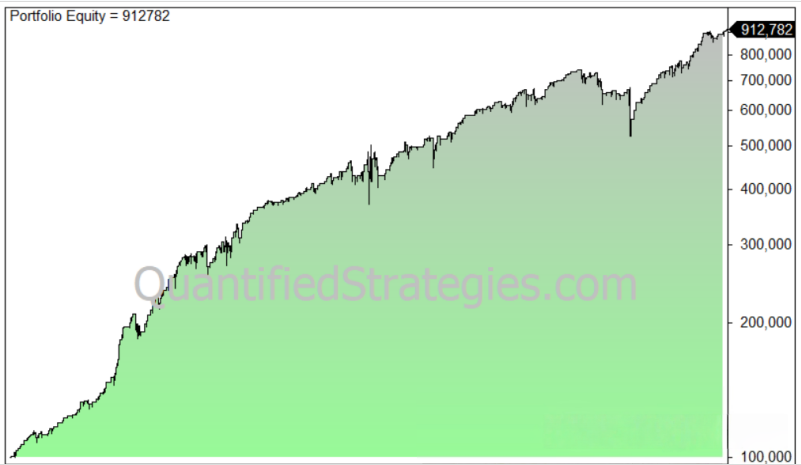
The compound annual growth rate (CAGR) is significantly lower than Williams %R: 7.3% versus 11.9%. Therefore, Williams %R appears to perform better than RSI on the S&P 500.
Of course, this difference may also be entirely due to randomness and chance. However, we recommend that traders test their RSI strategies to see if they can improve their strategies using Williams %R.
The combined strategy of Williams %R and RSI
We slightly adjusted the parameters and introduced a second indicator, testing the Nasdaq QQQ (logarithmic scale) from its inception in 1999 to the present, yielding the following results:
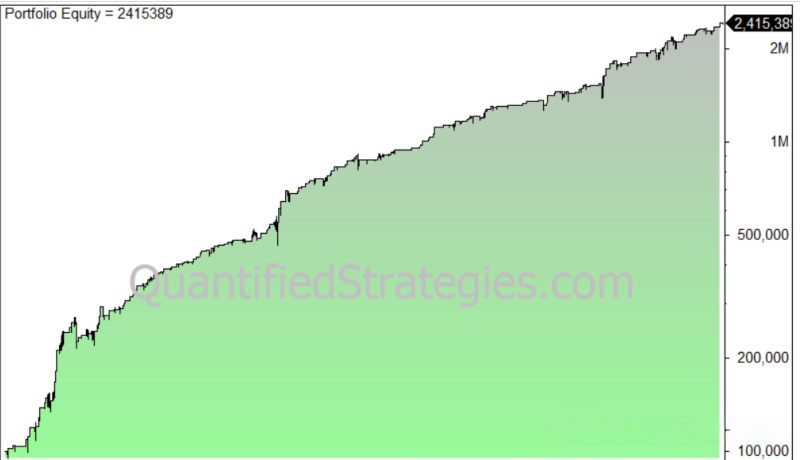
The compound annual growth rate (CAGR) is 13.4% (the buy-and-hold strategy is 9.9%), with a holding time accounting for 14% of total investment, a total of 251 trades, a win rate of 78%, an average profit of 2.3%, an average loss of 2.1%, a profit factor of 3.2, a maximum drawdown of 20.5%, and a Sharpe ratio of 2.9. These are quite robust data!
If we look at the risk-adjusted return, it is 96%.
Let's take a look at how this strategy has performed on the S&P 500 (SPY) since its inception; we obtained the following curve:
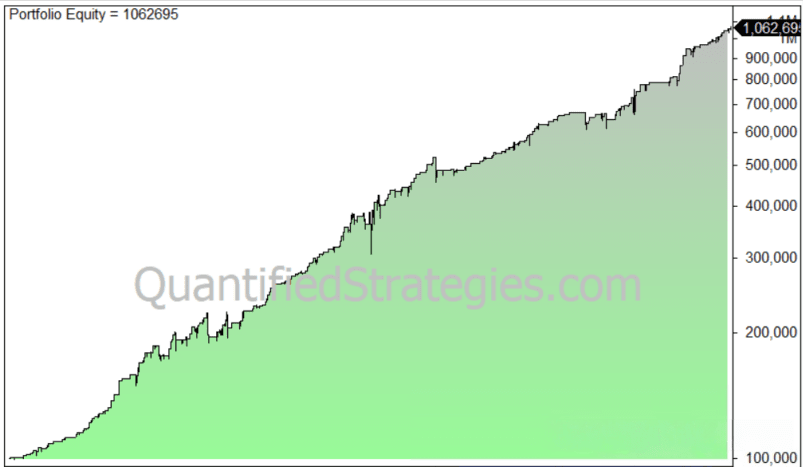
The average return of these 280 trades is 0.88%, with a win rate of 81%. A high win rate comes at a cost: average profits are far lower than average losses, being 1.6% compared to 2.2%. Mean reversion strategies typically have a high win rate, while profits and losses exhibit a certain asymmetry (profits are lower than losses). Nevertheless, the performance of this strategy remains outstanding!
Conclusion: Williams %R is indeed effective.
The trading strategy of Williams %R is very similar to that of Williams Vix Fix, but in our backtests, Williams %R performed slightly better. Additionally, across a broader range of backtests, Williams %R also outperformed RSI and random indicators among the strategies we tested.
In light of this, we believe that Williams %R is a severely undervalued technical indicator in the market!
This is the trading experience that Yan An shared with everyone today. Many times, you lose many profitable opportunities due to your doubts. If you don't dare to boldly try, engage, and understand, how can you know the pros and cons? You only know what to do next after taking the first step. A warm cup of tea and a word of advice, I am both a teacher and a talkative friend to you.
Fate brings us together; knowing each other is destiny. I firmly believe that those destined to meet will eventually do so, and those who miss each other is fate. The journey of investment is long; temporary gains and losses are just the tip of the iceberg along the way. One must know that even the wisest can make mistakes, and even the foolish can achieve gains. Regardless of emotions, time will not stand still for you. Pick up the burdens in your heart, stand up again, and move forward.
The secret techniques have been shared; whether one can achieve fame in the martial arts world depends on oneself.
Everyone must save these methods; for those who find them useful, feel free to share them with more cryptocurrency traders around you. Follow me for more insights in the crypto space. After getting soaked in the rain, I am willing to hold an umbrella for the chives! Follow me, and let's walk hand in hand on the path of cryptocurrency!