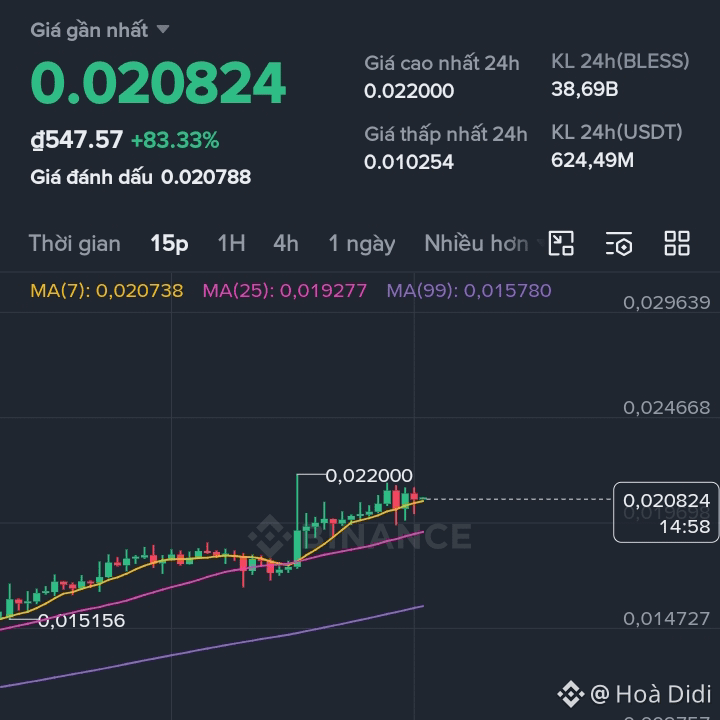
#BLESSUSD $BLESS/USDT - 15M Chart
The short-term trend is still bullish when the price stays above the MA7, MA25, and MA99. After a strong surge, the price is currently moving sideways just below the 0.0220 resistance zone, showing that profit-taking has appeared, but the bulls have not lost control yet.
The scenario I’m watching:
📈 Break 0.0220 with increased volume → target 0.0228 - 0.0235.
📉 If the 0.0205 - 0.0207 zone is lost → the price may correct to 0.0198 - 0.0192 before finding a balance point.
Personal strategy:
Don’t FOMO when the green candle is too long.
Prefer waiting for a breakout with volume, or wait for a pullback back to support before entering a trade.
Always set a stop-loss to manage risk.
What do you think—will BLESS break above 0.0220 to keep flying, or will it be rejected and correct? 🚀📉
Or a shorter version:
BLESS/USDT (15M): The trend is still up when the price holds above the MA lines. The 0.0220 zone is a decisive resistance. A breakout with volume → expectation of 0.023+. If it breaks down below 0.0205, then it’s better to wait for a deeper correction first before considering an entry. Bro, go LONG or wait for SHORT? 👇
The short-term trend is still bullish when the price stays above the MA7, MA25, and MA99. After a strong surge, the price is currently moving sideways just below the 0.0220 resistance zone, showing that profit-taking has appeared, but the bulls have not lost control yet.
The scenario I’m watching:
📈 Break 0.0220 with increased volume → target 0.0228 - 0.0235.
📉 If the 0.0205 - 0.0207 zone is lost → the price may correct to 0.0198 - 0.0192 before finding a balance point.
Personal strategy:
Don’t FOMO when the green candle is too long.
Prefer waiting for a breakout with volume, or wait for a pullback back to support before entering a trade.
Always set a stop-loss to manage risk.
What do you think—will BLESS break above 0.0220 to keep flying, or will it be rejected and correct? 🚀📉
Or a shorter version:
BLESS/USDT (15M): The trend is still up when the price holds above the MA lines. The 0.0220 zone is a decisive resistance. A breakout with volume → expectation of 0.023+. If it breaks down below 0.0205, then it’s better to wait for a deeper correction first before considering an entry. Bro, go LONG or wait for SHORT? 👇