

Don't idealize stability. I've been trading for 11 years, and full-time for 7 years. My life is quite free and relaxed, with little pressure. The returns from consistent profitability are certainly much better than those of a typical salaried worker. But these returns do have limits—certainly not the kind of wealth that everyone imagines grabbing all the riches in the world.
It took me 7 years to figure out a trading system that suits me, and even then, I only had an epiphany after being guided by an expert! Although I haven't become extremely wealthy, I've achieved steady profitability and can consistently outperform over 90% of people.
I understood a long time ago that an excellent trading system can effectively help investors make investments. I also realized that without a trading system, investing aimlessly will inevitably lead to more losses than gains. However, summarizing a trading system is truly difficult. An excellent trading system is also counterintuitive—it requires you to overcome greed and fear, to make decisive moves, avoid subjective judgments, and strictly adhere to the rules.
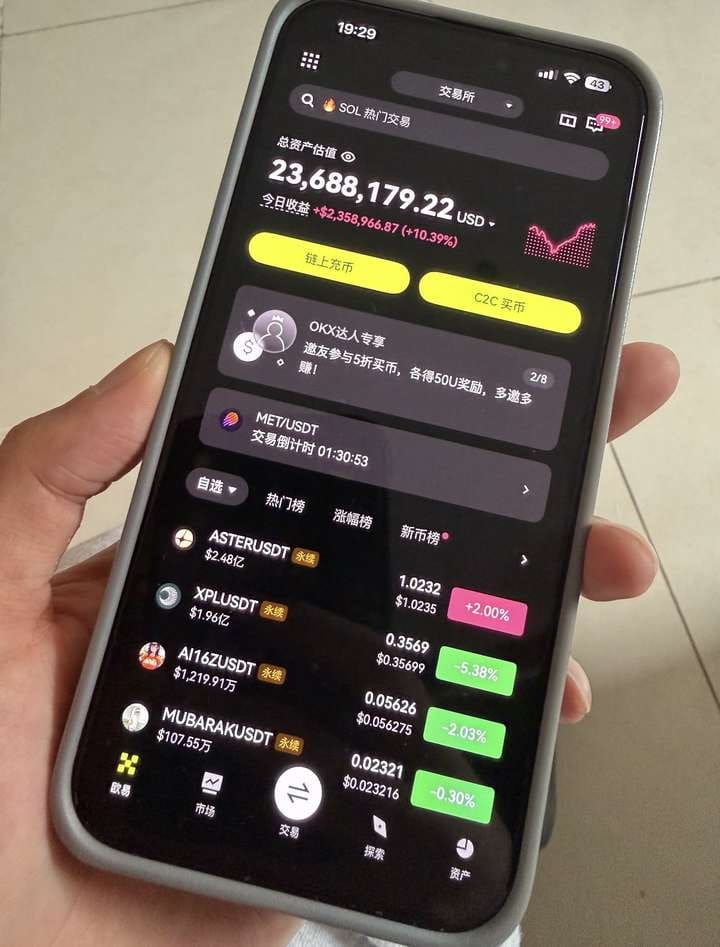
In trading, I’ve seen far too many “beautiful chart patterns” that fail to deliver even a single profitable trade in live markets. As a trader, I’ve always wondered: which bullish patterns can actually make money?
After reviewing extensive historical data and live-trading examples, I discovered some surprising patterns. Research by Barry D. Moore, an IFTA-certified technical analyst, shows that several bullish chart patterns have incredibly high success rates, with average gains after breaking resistance exceeding 50%.#加密市场观察
If you also want to avoid common pitfalls and seize opportunities when trading chart patterns, be sure to read what follows carefully.
Barry’s research shows that the most reliable and accurate bullish patterns include the cup and handle, with a bullish success rate of up to 95%; the head and shoulders, with a success rate of 89%; the double bottom, at 88%; and the triple bottom, at 87%.
In terms of profitability, the cup and handle and the bullish rectangle top are the most profitable chart patterns, with average gains of 54% and 51%, respectively.
Bullish patterns generally suggest that prices may rise in the future, but not all patterns are highly accurate or profitable. Identifying which patterns are genuinely profitable can help traders keep reaching new highs.
The reliability and profitability of bullish chart patterns
The table below shows the success rates of bullish chart patterns—that is, the probability that prices will continue rising after breaking above the pattern’s resistance in a bull market—as well as the average price gain after the breakout.
For example, after the cup and handle breaks above resistance, its success rate is as high as 95%, with an average gain of 54%.
Statistics on the success rates and average gains of bullish chart patterns:
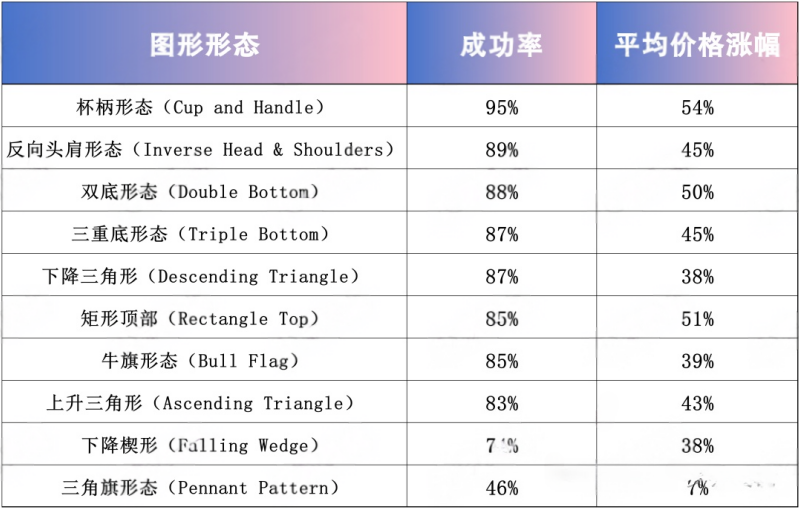
All statistics in this article are quoted with permission from Tom Bulkowski’s classic work, The Encyclopedia of Chart Patterns (Wiley, 2021).
10 proven bullish patterns that are both reliable and highly profitable
1. Cup and handle pattern: 95% bullish success rate
Research shows that the cup and handle is a bullish continuation pattern with a success rate of up to 95%. It consists of two distinct parts: the “cup” and the “handle.”
The “cup” typically forms when the price first declines, then rallies and ends near its starting level, creating a U-shaped or “cup-like” structure on the chart. The “handle” appears when the price pulls back again, usually by 5%–20% and near the cup’s low, before the price resumes its upward trend.
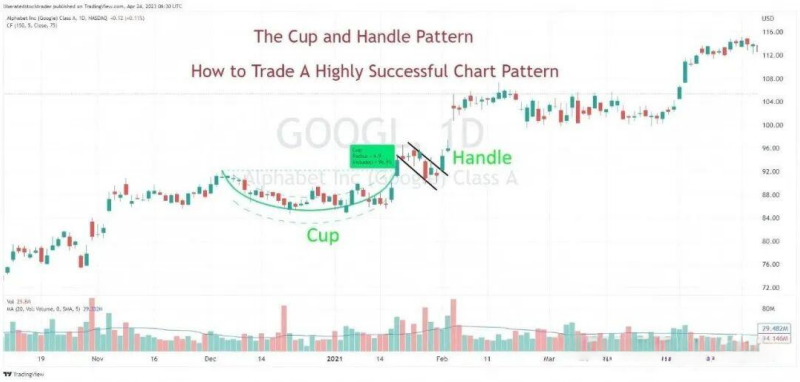
The cup and handle pattern can be difficult to identify. First, look for a “cup” structure on the chart: after the asset’s price rises and pulls back, it forms a long U-shaped curve lasting at least 30 trading days. Then, on the right side of the cup, you’ll see the “handle,” formed by two downward-sloping trendlines. The handle’s downward slope should be gentler than the cup’s, and it should last at least five trading days.
The pattern is considered complete and breaks upward when the asset’s price moves above the highest point of the cup (the resistance level). This usually signals the beginning of a strong uptrend. Traders often look for a noticeable increase in trading volume to confirm the breakout.
After the breakout, the price often enters an uptrend that lasts anywhere from several weeks to several months.
2. Inverse head and shoulders pattern: 89% bullish success rate
The inverse head and shoulders pattern, also known as an “inverted head and shoulders,” is a highly bullish chart pattern with a strong likelihood of triggering a powerful uptrend. Extensive research shows that it reverses an existing downtrend with a success rate of up to 89%. Its average price gain is 45%, making it one of the most reliable chart patterns.
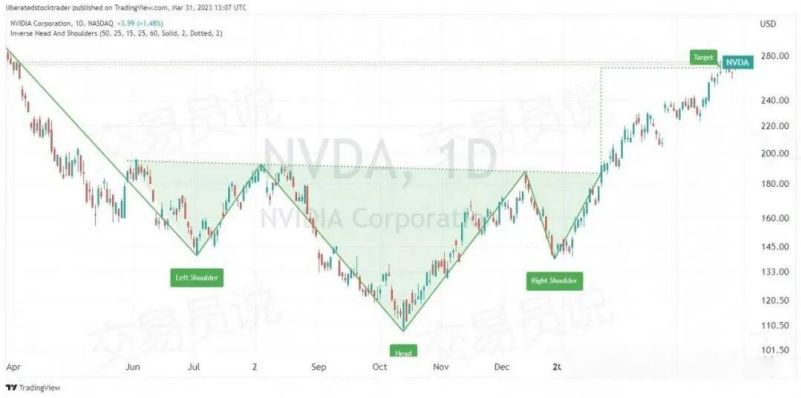
An inverse head and shoulders pattern typically forms as the price touches a bottom three times. The two higher lows form the “shoulders,” while the third, lower low forms the “head.” The pattern often signals that the price is about to move upward.
For decades, the inverse head and shoulders pattern has been considered a reliable indicator of a potential trend reversal. Its reliability stems from the fact that the pattern must test the same resistance level (the neckline) three times and then make a valid breakout above the neckline before it can be considered complete. This strict confirmation requirement significantly improves the accuracy and credibility of the signal.
3. Double bottom pattern: 88% bullish success rate
The double bottom pattern is a technical analysis trading strategy that traders use to try to identify potential market reversal points. It consists of two consecutive lows separated by a rebound high, forming a clear “W” shape on the price chart.
In a bull market, the double bottom is considered a reliable trend reversal signal, with a success rate of 88%. This is because when the price breaks above the high between the two lows, buyers begin to take control, and the market trend may shift from bearish to bullish.
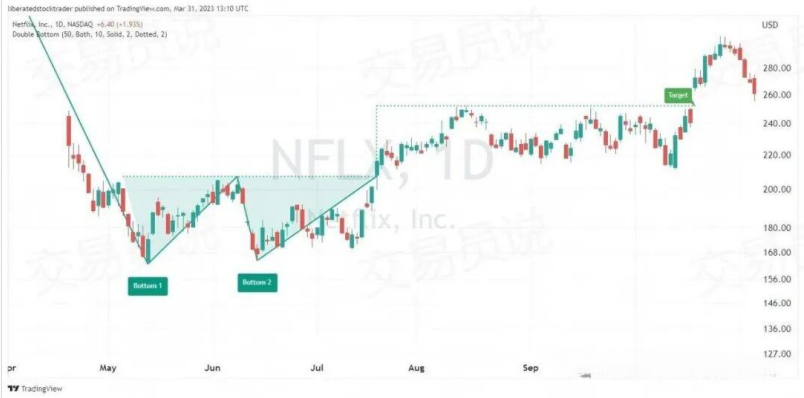
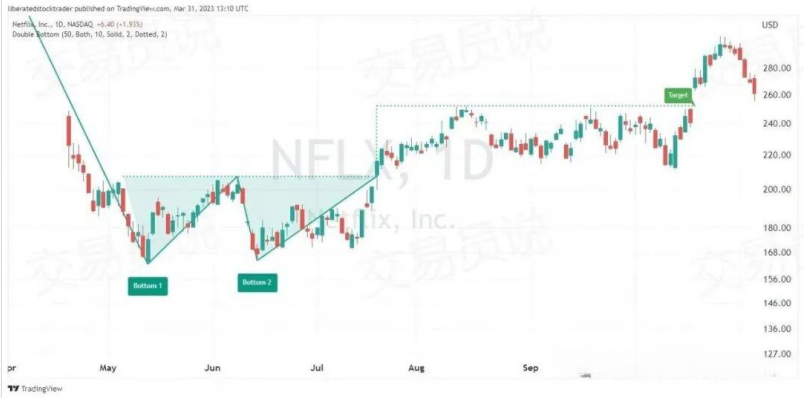
To identify a double bottom, look for two distinct lows in the security’s price that form a “W” shape. The pattern can generally appear on intraday charts and can also be clearly seen on daily charts.
4. Triple bottom pattern: 87% bullish success rate
The triple bottom is a technical analysis trading strategy that traders use to try to identify market trend reversal points. It consists of three consecutive lows separated by rebound highs, forming a “VVV” shape on the price chart.
To identify a triple bottom, look for a security’s price forming three distinct lows that create a “VVV” shape. The pattern can generally be seen on both intraday and daily charts, and it appears more frequently on 15-minute and 1-hour charts.
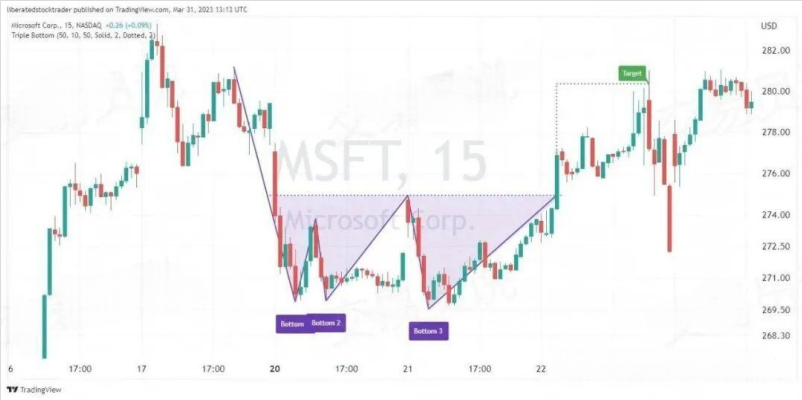
In a bull market, the triple bottom is considered a reliable reversal signal, with a success rate of about 87%. This is because when the price breaks above the rebound highs between the three lows, buyers begin to dominate the market, and the trend may shift from bearish to bullish.
5. Descending triangle: 87% bullish success rate
The descending triangle is a powerful technical analysis pattern with a reported prediction accuracy of 87%. It is highly flexible: price can break either upward or downward, so it can act as either a continuation or a reversal pattern.
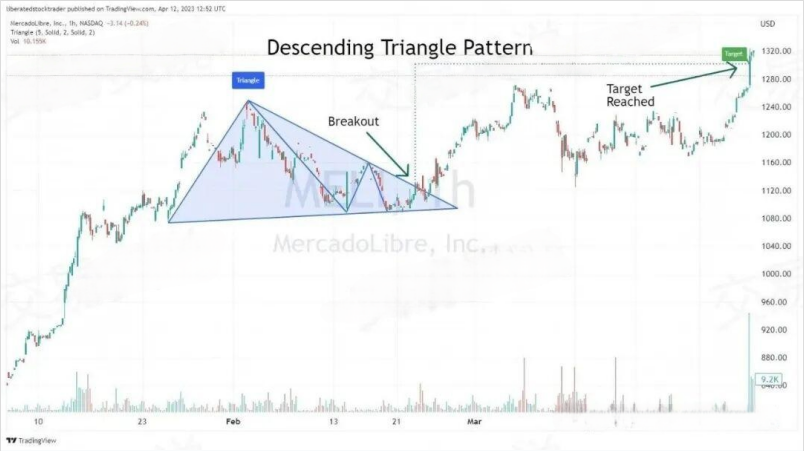
A descending triangle consists of two key trendlines: a downward-sloping trendline connecting a series of lower highs, and a horizontal trendline connecting a series of lows.
Depending on the direction of the eventual breakout, a descending triangle can be bearish or bullish, and may be either a continuation or a reversal pattern.
In a bull market, the descending triangle is considered a reliable continuation or reversal signal when the price breaks above its upper boundary, with a success rate of about 87%. This is because once the price breaks out of the triangle, buyers begin to take control and drive the market higher.
6. Rectangle pattern: 85% bullish success rate
The rectangle pattern is a well-established and widely tested technical analysis chart pattern, with a prediction accuracy of about 85%. It is highly flexible: price can break either upward or downward, so it can act as either a continuation or a reversal pattern. Whether the rectangle is ultimately bullish or bearish depends on the direction of the breakout.
This pattern is also known as a “rectangular consolidation,” a “box,” or a “rectangle range pattern.”
A rectangle pattern usually appears after a strong price move and represents a period of consolidation or rest. It can also form in a range-bound market or during periods of low volatility.
7. Bull flag pattern: 85% bullish success rate
The bull flag is a very popular but often misunderstood technical analysis pattern. It is characterized by a rapid price rise followed by consolidation within a parallel, downward-sloping channel. The sharp rise resembles a “flagpole,” while the subsequent consolidation forms the “flag.”
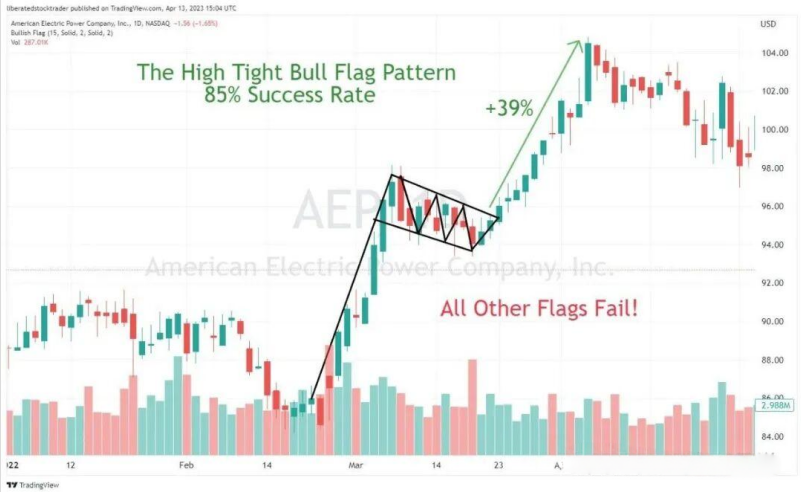
A bull flag is a continuation pattern that typically forms after a sharp price surge, followed by a downward consolidation. This consolidation occurs as traders take profits and close positions in a strong market, while some traders try to short the asset, resulting in a brief pullback.
Most flag consolidations slope in the opposite direction to the preceding trend, but some flags consolidate horizontally and look similar to rectangle patterns.
There are three main types of flag patterns: the bull flag, the bear flag, and the high-tight bull flag. A study of 1,028 trades found that standard, looser flag patterns had a failure rate as high as 55%. By contrast, the high-tight bull flag had a success rate of 85% and an average gain of 39%.
8. Ascending triangle: 83% bullish success rate
The ascending triangle is a reliable bullish continuation pattern favored by experienced traders.
The ascending triangle is a powerful technical analysis chart pattern with a prediction accuracy of about 83%. It is somewhat flexible: price can break either upward or downward, so it can act as either a continuation pattern or develop into a reversal pattern.
An ascending triangle consists of two key trendlines: an upward-sloping trendline connecting a series of higher lows, and a horizontal trendline connecting a series of highs.
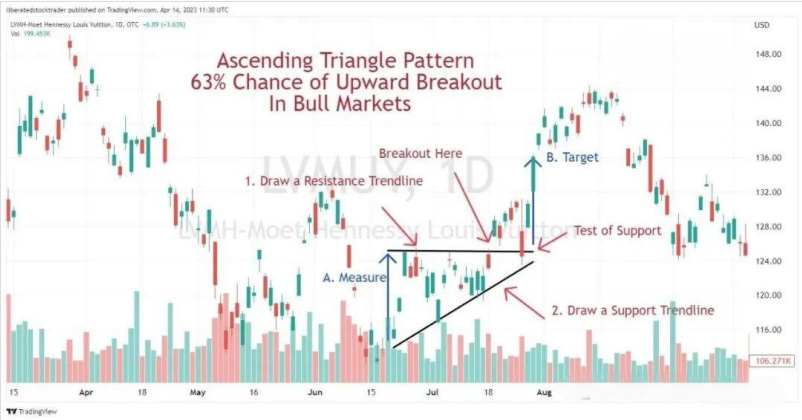
An ascending triangle begins to form when sellers dominate near resistance. As buyers gradually gain strength, demand starts to exceed supply and the lows keep rising. Eventually, the price breaks out in one direction, confirming either a continuation or a reversal of the trend.
9. Falling wedge: 74% bullish success rate
The falling wedge is considered a bullish wedge pattern that usually signals a rally after an upward breakout. This technical analysis pattern has a prediction accuracy of about 74%. Although price can break either upward or downward, the pattern is generally bullish: historical statistics show that it breaks upward 68% of the time.
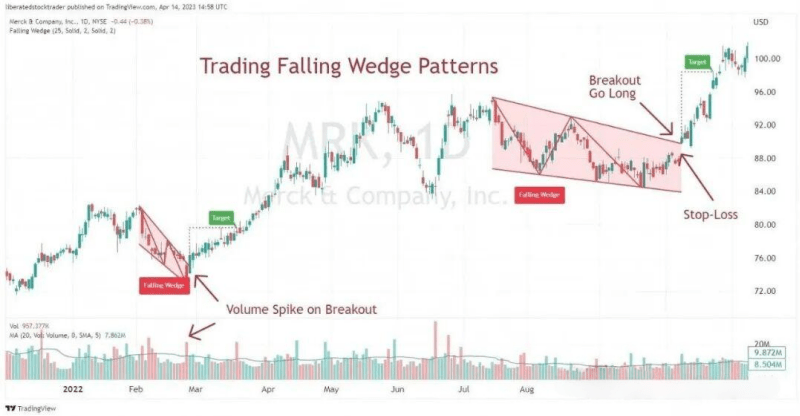
A falling wedge forms after an asset’s price has risen but then fails to continue along its original upward trajectory. Instead, the trading range gradually narrows and converges. This convergence is defined by two downward-sloping trendlines that approach each other, one above and one below the price.
When traders spot a falling wedge, they should be cautious. As the price continues to move lower and the trading range narrows, selling pressure is pushing the price down. However, as the market gradually clears out, buyers have a 68% chance of eventually taking control and triggering an upward breakout.
10. Pennant pattern: 54% bullish success rate
The bullish pennant pattern is a widely discussed but often misunderstood technical analysis chart pattern. It is characterized by a period of consolidation in the shape of a symmetrical triangle after a rapid price surge. It is generally considered a continuation pattern and appears after a sharp upward move.
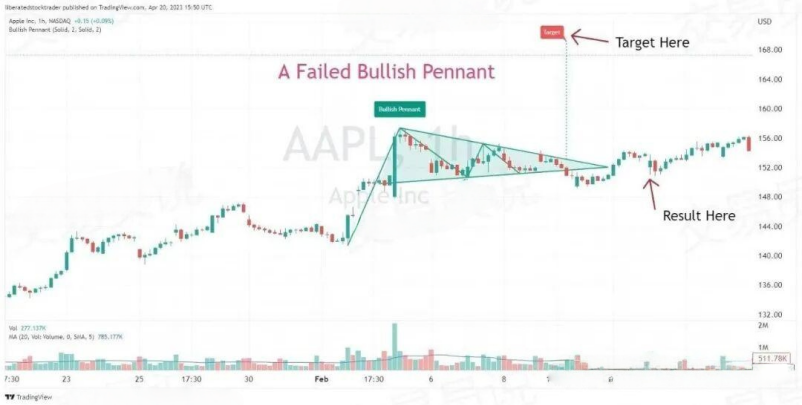
The pattern consists of two converging trendlines connecting the price highs and lows, followed by an upward breakout.
However, statistically speaking, the bullish pennant is not very reliable. In a bull market, its upward breakout success rate is only 54%, with an average gain of about 7%. Its failure rate is as high as 46%, so traders should be especially cautious in practice and avoid relying on it too heavily.
Summary
According to Tom Bulkowski’s The Encyclopedia of Chart Patterns, 38 bullish patterns have been identified, documented, and tested to date. Traders can try learning each pattern individually or use pattern recognition software to help identify them.
The key to trading bullish patterns is timing market turning points. Traders should watch for signals that a pattern is forming, such as a sudden increase in volume or a narrowing price range. Once a bullish pattern is identified, traders can act based on their interpretation of the data.
Bullish patterns are best analyzed on daily and weekly charts. Research shows that the longer the time frame, the more reliable and accurate chart patterns tend to be. Patterns may be less accurate on short time frames of 1 to 10 minutes, where the influence of large institutional trades can cause unusual short-term volatility.
That’s all for today’s trading insights from Yan’an. Sometimes, doubt causes you to miss many opportunities to make money. If you don’t dare to try, explore, or learn, how will you know the pros and cons? Only by taking the first step can you figure out where to go next. A cup of warm tea and a word of advice—I’m both a teacher and a friend you can talk to.
Meeting is fate; getting to know each other is a matter of circumstance. I firmly believe that fate can bring people together even across great distances, while missing each other is simply destiny. The road of investing is long, and any short-term gain or loss is just the tip of the iceberg along the way. Remember, even the wisest can make mistakes, and even the foolish can sometimes be right. Whatever your emotions, time will not stop for you. Put aside your worries, get back on your feet, and set out again.
The secret techniques have been laid out for you. Whether you make a name for yourself in the trading world is up to you.
Be sure to save these methods and read them over a few times. If you find them useful, share them with more people around you who trade crypto. Follow me to learn more practical crypto trading tips. Having weathered the storm, I’m here to hold an umbrella for fellow retail traders! Follow me, and let’s walk the crypto journey together!