Hello everyone,
Today I want to share an analysis based on price behavior over the last 30 days of $BTC , focused on areas of highest buying pressure and the moving average structure.
🔵 Areas of highest buying pressure
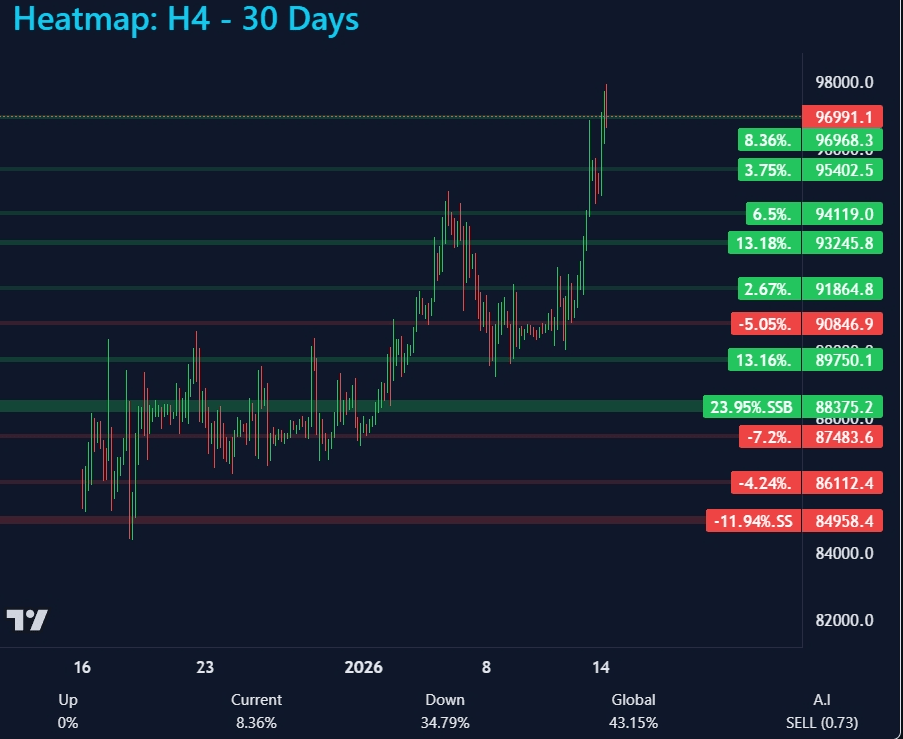
23.95% of buying pressure is concentrated in the $88.375 zone
13.16% is located around $89.375
13.18% appears near $93.245
These areas stand out as zones where the market showed the greatest buying interest and where price could react again.
📈 Moving averages (EMA)
The long EMAs of 25, 50, and 100 days are already aligned in favor of the upward trend.
The 200-day EMA (gold) still remains slightly short, although not showing significant pressure for now.
This partial cross suggests a structure that is beginning to consolidate upward, although still with some caution.
🔍 Possible scenarios
Main scenario:
If no unexpected macro event occurs in the coming days, the price could seek liquidity slightly below $93.245 before continuing with the upward movement.
More drastic scenario (less likely):
A clear break of $88.375 could invalidate the current scenario and open the door to a deeper correction.
💬 What do you all think?
Do you see the market taking liquidity upwards before continuing, or do you think a larger correction is still needed?
Disclaimer
This article is for informational and educational purposes only. It does not constitute financial advice or a recommendation for investment. Financial markets involve risks, and each investor must conduct their own research and analysis before making any decisions. The author is not responsible for any losses resulting from the use of the information presented here.