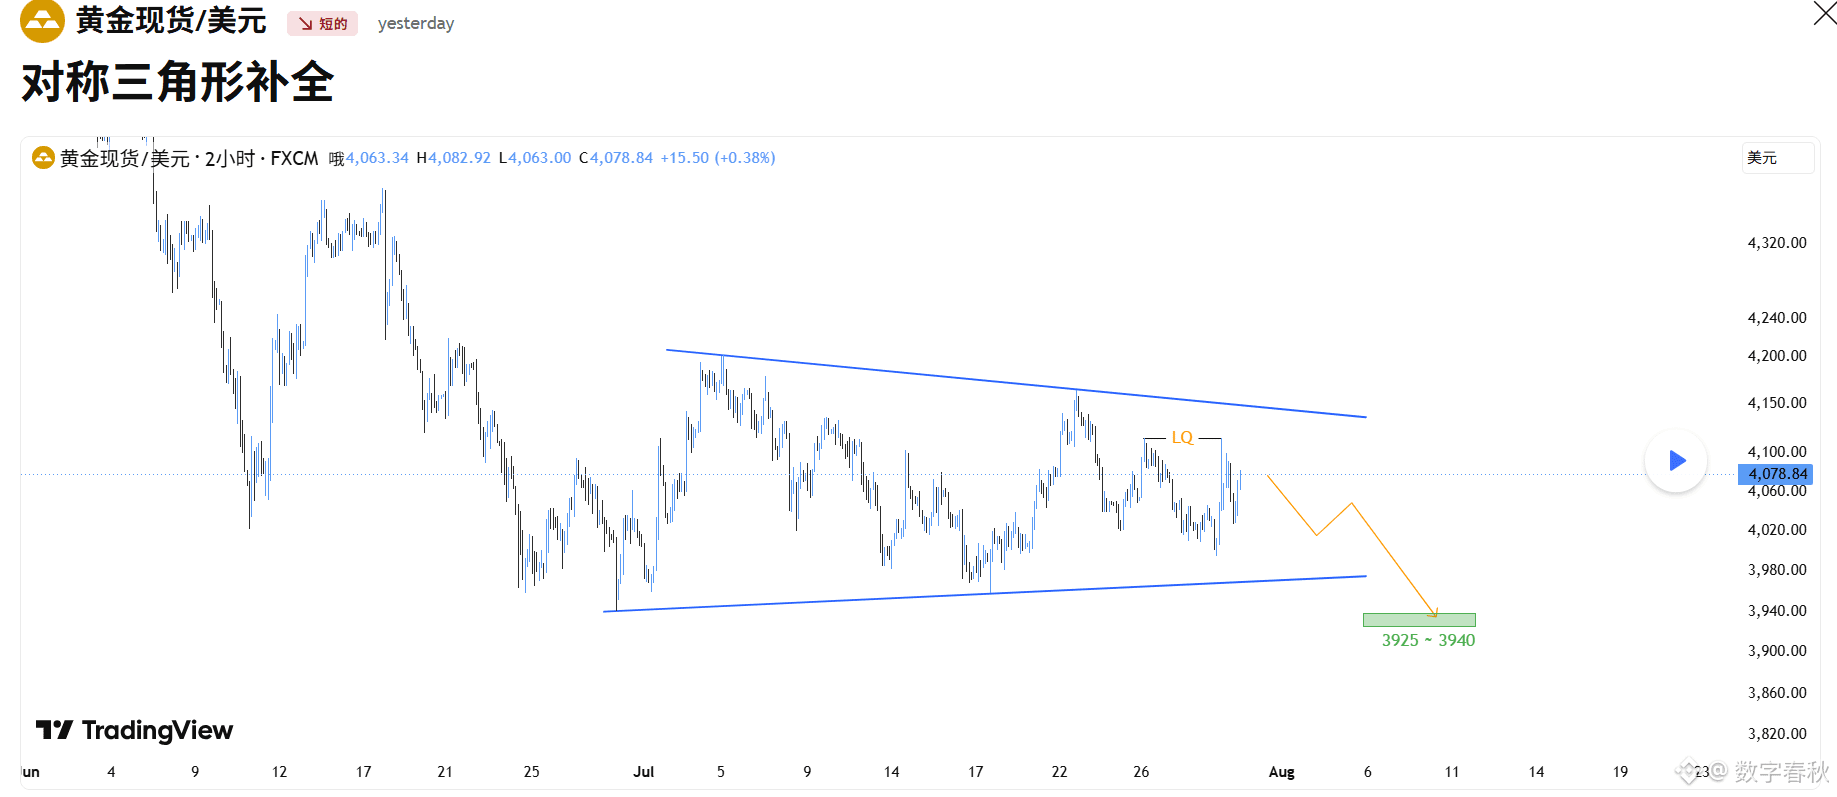
XAU/USD|Symmetrical triangle nearing completion; next downside target 3925–3940
Time frame: 2 hours|Reference price: 4077
XAU/USD is still trading within a large symmetrical triangle. This pattern formed after a significant selloff earlier on; it is more likely to be viewed as a corrective consolidation rather than a confirmatory accumulation structure. The price keeps forming lower highs below the descending trendline, while the ascending trendline temporarily supports the price and limits further downside from the bears.
My main expectation is that this corrective phase is nearing its end, and the market may begin the next leg of decline. The primary target lies at the 3925–3940 support area and the liquidity zone.
It’s important to note that as long as price remains within the triangle, the bearish view has not yet been confirmed. True confirmation requires a breakdown of the internal support and the ascending trendline, followed by sustained trading below the structure after the breakout. If price breaks above and holds above the descending trendline, the entire bearish setup would be invalidated, and the market would shift toward bullish expansion.
Macroeconomic backdrop
Gold is currently influenced by four factors:
1) Real yields remain elevated;
2) The Fed’s policy outlook still has uncertainty;
3) Inflation risks persist;
4) Geopolitical risks in the Middle East are intensifying.
The Fed holds interest rates steady at **3.50%–3.75%**, but three policymakers still support further rate hikes. This suggests inflation pressure is still being taken seriously, and the market cannot yet confirm that monetary policy is about to turn toward easing.
The U.S. dollar remains strong, which will continue to weigh on gold’s performance. As long as U.S. tightening expectations have not changed meaningfully, any gold rebound is more likely to be corrective rather than a trend reversal. If the dollar weakens significantly, the probability of gold breaking higher would increase.
Real yields are still the biggest macro pressure on gold. High yields raise the opportunity cost of holding non-yielding assets like gold. If future U.S. inflation and economic data continue to support real yields staying high, gold may still see further weakness; conversely, if yields keep falling, the current bearish structure would be undermined.
Key resistance:
4095–4115: buyers’ liquidity zone;
4140–4160: structure invalidation zone.
Key support:
4020–4005: internal support;
3970–3985: lower boundary of the triangle;
3925–3940: main target zone for this leg.
Time frame: 2 hours|Reference price: 4077
XAU/USD is still trading within a large symmetrical triangle. This pattern formed after a significant selloff earlier on; it is more likely to be viewed as a corrective consolidation rather than a confirmatory accumulation structure. The price keeps forming lower highs below the descending trendline, while the ascending trendline temporarily supports the price and limits further downside from the bears.
My main expectation is that this corrective phase is nearing its end, and the market may begin the next leg of decline. The primary target lies at the 3925–3940 support area and the liquidity zone.
It’s important to note that as long as price remains within the triangle, the bearish view has not yet been confirmed. True confirmation requires a breakdown of the internal support and the ascending trendline, followed by sustained trading below the structure after the breakout. If price breaks above and holds above the descending trendline, the entire bearish setup would be invalidated, and the market would shift toward bullish expansion.
Macroeconomic backdrop
Gold is currently influenced by four factors:
1) Real yields remain elevated;
2) The Fed’s policy outlook still has uncertainty;
3) Inflation risks persist;
4) Geopolitical risks in the Middle East are intensifying.
The Fed holds interest rates steady at **3.50%–3.75%**, but three policymakers still support further rate hikes. This suggests inflation pressure is still being taken seriously, and the market cannot yet confirm that monetary policy is about to turn toward easing.
The U.S. dollar remains strong, which will continue to weigh on gold’s performance. As long as U.S. tightening expectations have not changed meaningfully, any gold rebound is more likely to be corrective rather than a trend reversal. If the dollar weakens significantly, the probability of gold breaking higher would increase.
Real yields are still the biggest macro pressure on gold. High yields raise the opportunity cost of holding non-yielding assets like gold. If future U.S. inflation and economic data continue to support real yields staying high, gold may still see further weakness; conversely, if yields keep falling, the current bearish structure would be undermined.
Key resistance:
4095–4115: buyers’ liquidity zone;
4140–4160: structure invalidation zone.
Key support:
4020–4005: internal support;
3970–3985: lower boundary of the triangle;
3925–3940: main target zone for this leg.