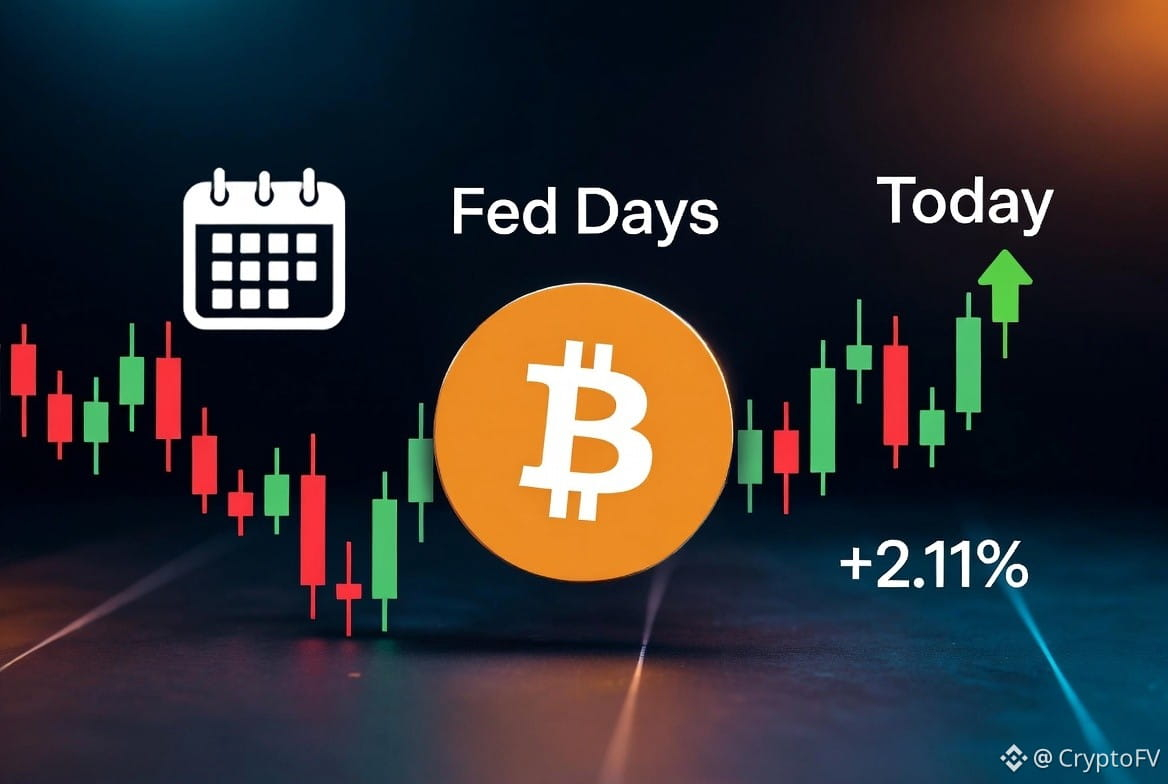
$BTC DOWN 8 OUT OF THE LAST 9 FED DAYS. UP 2.11% TODAY. THE PATTERN THAT EXPLAINS THIS ENTIRE CYCLE'S PRICE ACTION IN ONE STATISTIC.
8 out of 9 Fed days producing Bitcoin drawdowns is not a coincidence and it's not noise. It's a data pattern that tells you exactly what kind of market we're in right now. This is a liquidity expectations market not a fundamentals market and those two things require completely different analysis frameworks.
When Bitcoin drops on Fed days it means participants are pricing the asset based on what the Fed does to global liquidity conditions rather than on what Bitcoin's on-chain metrics say about adoption network security or supply dynamics. The fundamentals could be perfect and price still drops if the Fed signals tighter for longer because the liquidity that flows into risk assets including Bitcoin is the variable that matters more than anything on-chain right now.
Today's 2.11% green day is encouraging but it arrived in a Fed-light window. The real test Saylor keeps referencing isn't the price level it's whether this green day holds into the next policy meeting or fades the moment Fed commentary reintroduces rate uncertainty.
My honest take is that understanding the 8 out of 9 pattern changes how you manage risk this cycle. The on-chain data tells you the long term thesis is intact. The Fed calendar tells you when the short term volatility events are scheduled. Using both together instead of ignoring one gives you a more complete picture.
Rate cut confirmation flips this pattern immediately. Every one of those 9 Fed days produced a different outcome in the rate cut confirmation scenario because the liquidity narrative reverses and the on-chain fundamentals suddenly start driving price again.
Are you watching the Fed calendar as closely as your on-chain indicators right now?
#Bitcoin #BTC #Fed #Macro #InterestRates #CryptoMarkets #Institutional
8 out of 9 Fed days producing Bitcoin drawdowns is not a coincidence and it's not noise. It's a data pattern that tells you exactly what kind of market we're in right now. This is a liquidity expectations market not a fundamentals market and those two things require completely different analysis frameworks.
When Bitcoin drops on Fed days it means participants are pricing the asset based on what the Fed does to global liquidity conditions rather than on what Bitcoin's on-chain metrics say about adoption network security or supply dynamics. The fundamentals could be perfect and price still drops if the Fed signals tighter for longer because the liquidity that flows into risk assets including Bitcoin is the variable that matters more than anything on-chain right now.
Today's 2.11% green day is encouraging but it arrived in a Fed-light window. The real test Saylor keeps referencing isn't the price level it's whether this green day holds into the next policy meeting or fades the moment Fed commentary reintroduces rate uncertainty.
My honest take is that understanding the 8 out of 9 pattern changes how you manage risk this cycle. The on-chain data tells you the long term thesis is intact. The Fed calendar tells you when the short term volatility events are scheduled. Using both together instead of ignoring one gives you a more complete picture.
Rate cut confirmation flips this pattern immediately. Every one of those 9 Fed days produced a different outcome in the rate cut confirmation scenario because the liquidity narrative reverses and the on-chain fundamentals suddenly start driving price again.
Are you watching the Fed calendar as closely as your on-chain indicators right now?
#Bitcoin #BTC #Fed #Macro #InterestRates #CryptoMarkets #Institutional