ETH Price Structure: From Decline to Rebound, and from Rebound to Decision
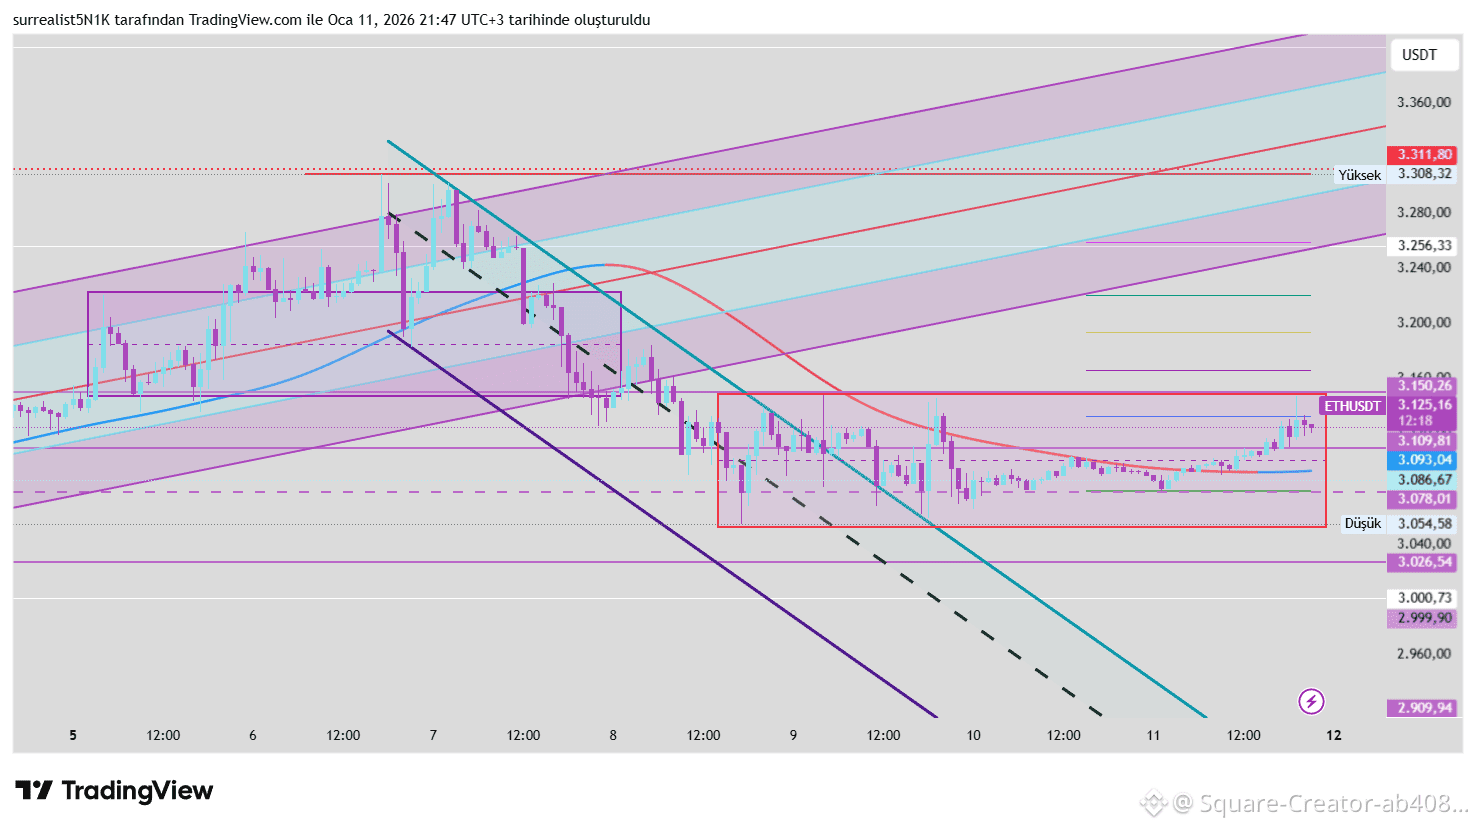
After ETH completed its latest decline within a clear descending channel, it entered a horizontal consolidation zone following a rebound from the low. This move is not panic; rather, it indicates a controlled, recalibrated pricing process.
The key structural pattern visible on the chart:
First, a downward-sloping trend (liquidity drainage)
Then, a broad range (3.080 – 3.150 zone)
Now, the price is approaching the upper boundary of the range
This tells us the following:
The market is absorbing liquidity before determining the next direction.
📌 Key Levels
3.150 – 3.160: Upper range boundary → Directional discussion only follows a breakout
3.080 – 3.050: Primary support → Must be protected without failure
🎯 Strategy Approach
No random long positions within the range
After breaking above the upper boundary, watch for a pullback (retest)
If it drops to the lower boundary, monitor reaction at support, and reduce risk upon a breakdown
Typically, such structures:
Keep impatient traders out
Provide time before a directional move
Currently, ETH is neither in a strong uptrend nor a weak downtrend.
It's not unstable—it's preparing.
In your opinion, will this structure be resolved by an upward breakout,
or will support be retested once again
After ETH completed its latest decline within a clear descending channel, it entered a horizontal consolidation zone following a rebound from the low. This move is not panic; rather, it indicates a controlled, recalibrated pricing process.
The key structural pattern visible on the chart:
First, a downward-sloping trend (liquidity drainage)
Then, a broad range (3.080 – 3.150 zone)
Now, the price is approaching the upper boundary of the range
This tells us the following:
The market is absorbing liquidity before determining the next direction.
📌 Key Levels
3.150 – 3.160: Upper range boundary → Directional discussion only follows a breakout
3.080 – 3.050: Primary support → Must be protected without failure
🎯 Strategy Approach
No random long positions within the range
After breaking above the upper boundary, watch for a pullback (retest)
If it drops to the lower boundary, monitor reaction at support, and reduce risk upon a breakdown
Typically, such structures:
Keep impatient traders out
Provide time before a directional move
Currently, ETH is neither in a strong uptrend nor a weak downtrend.
It's not unstable—it's preparing.
In your opinion, will this structure be resolved by an upward breakout,
or will support be retested once again