

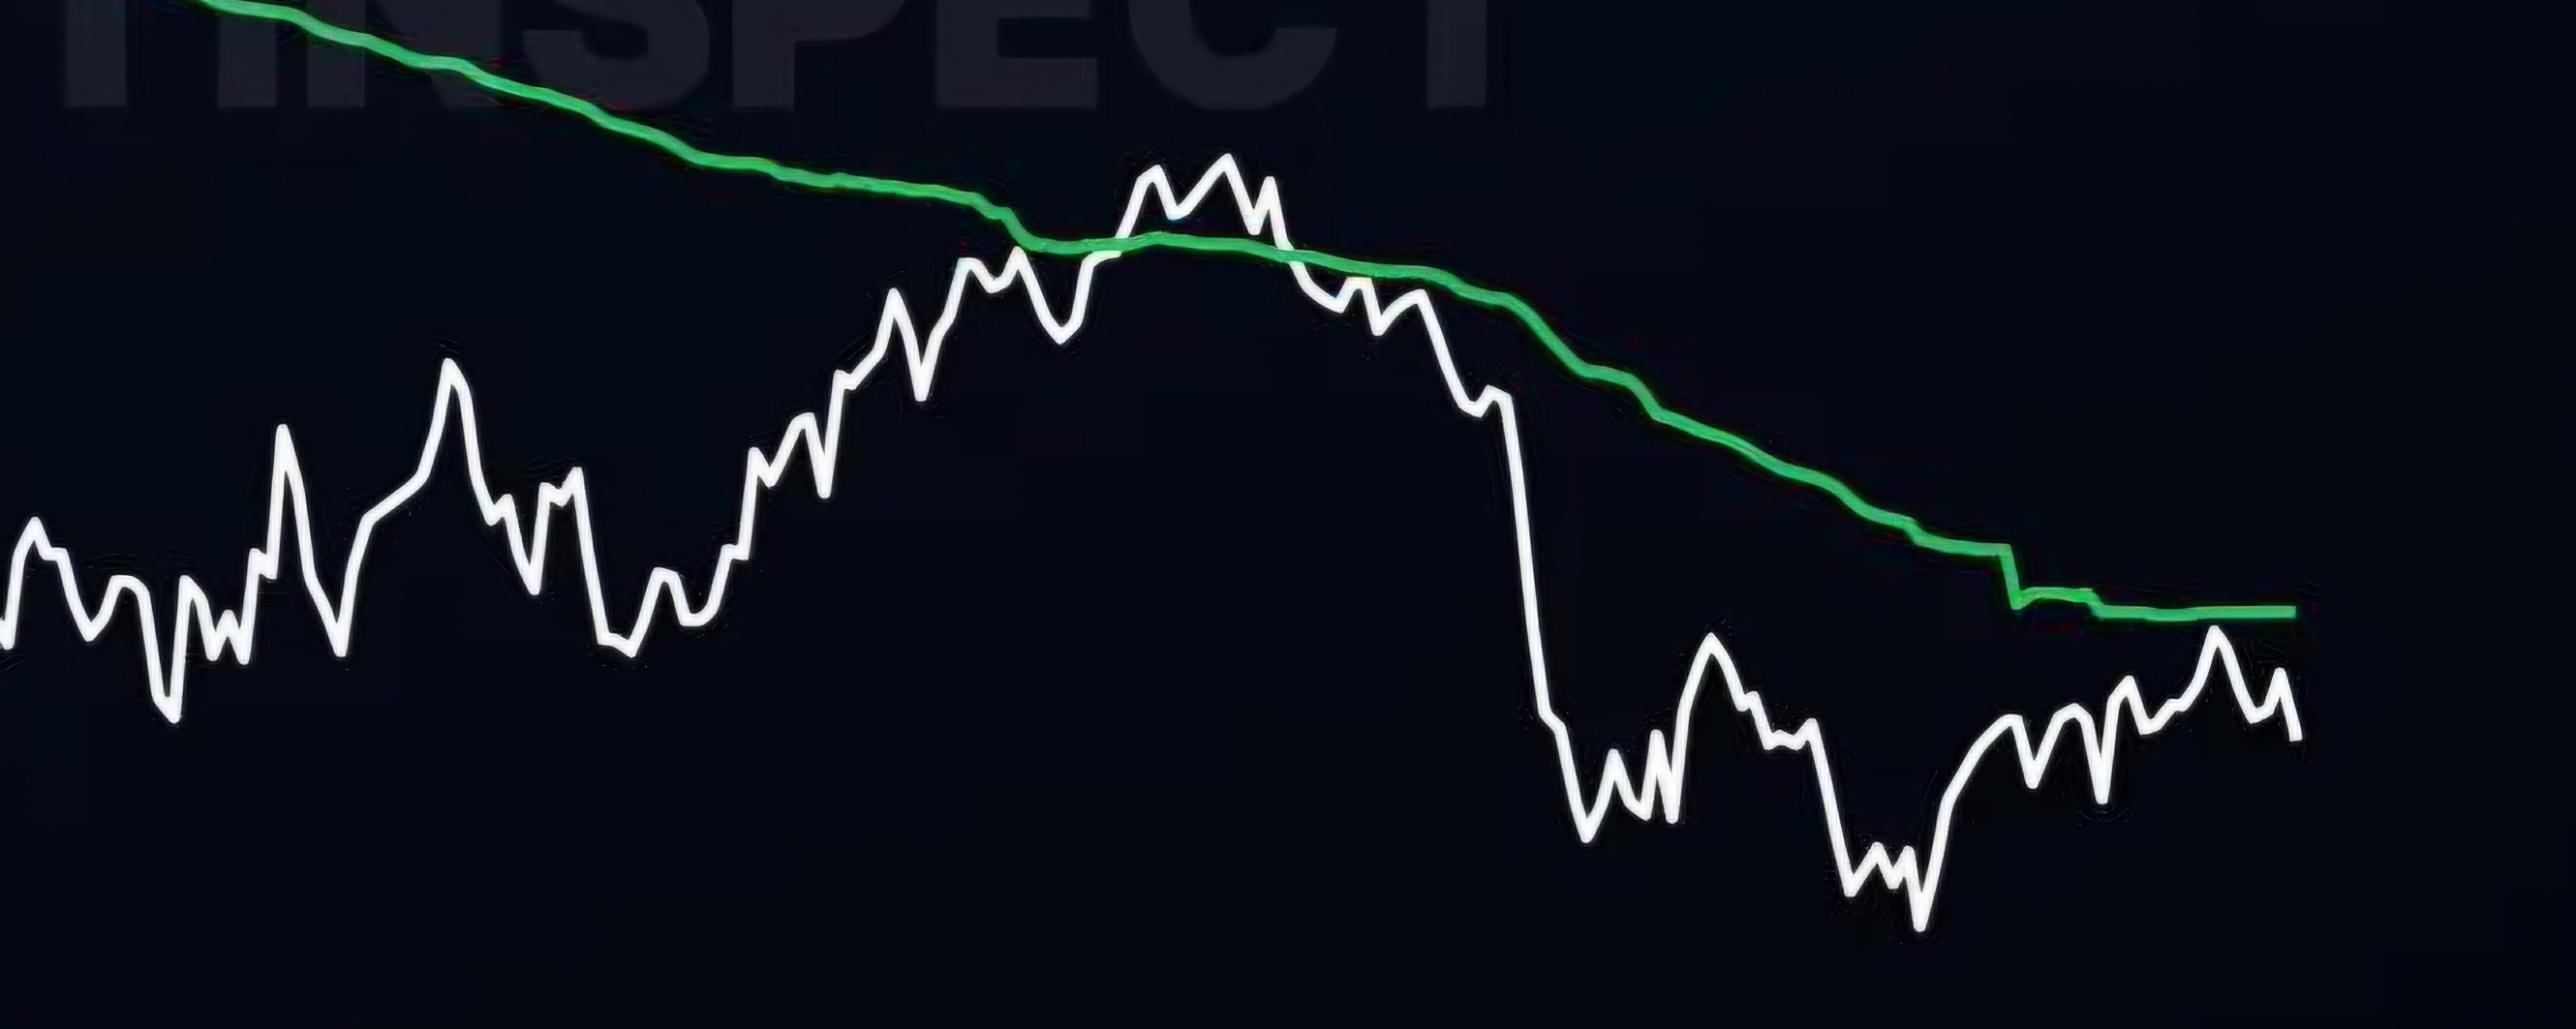

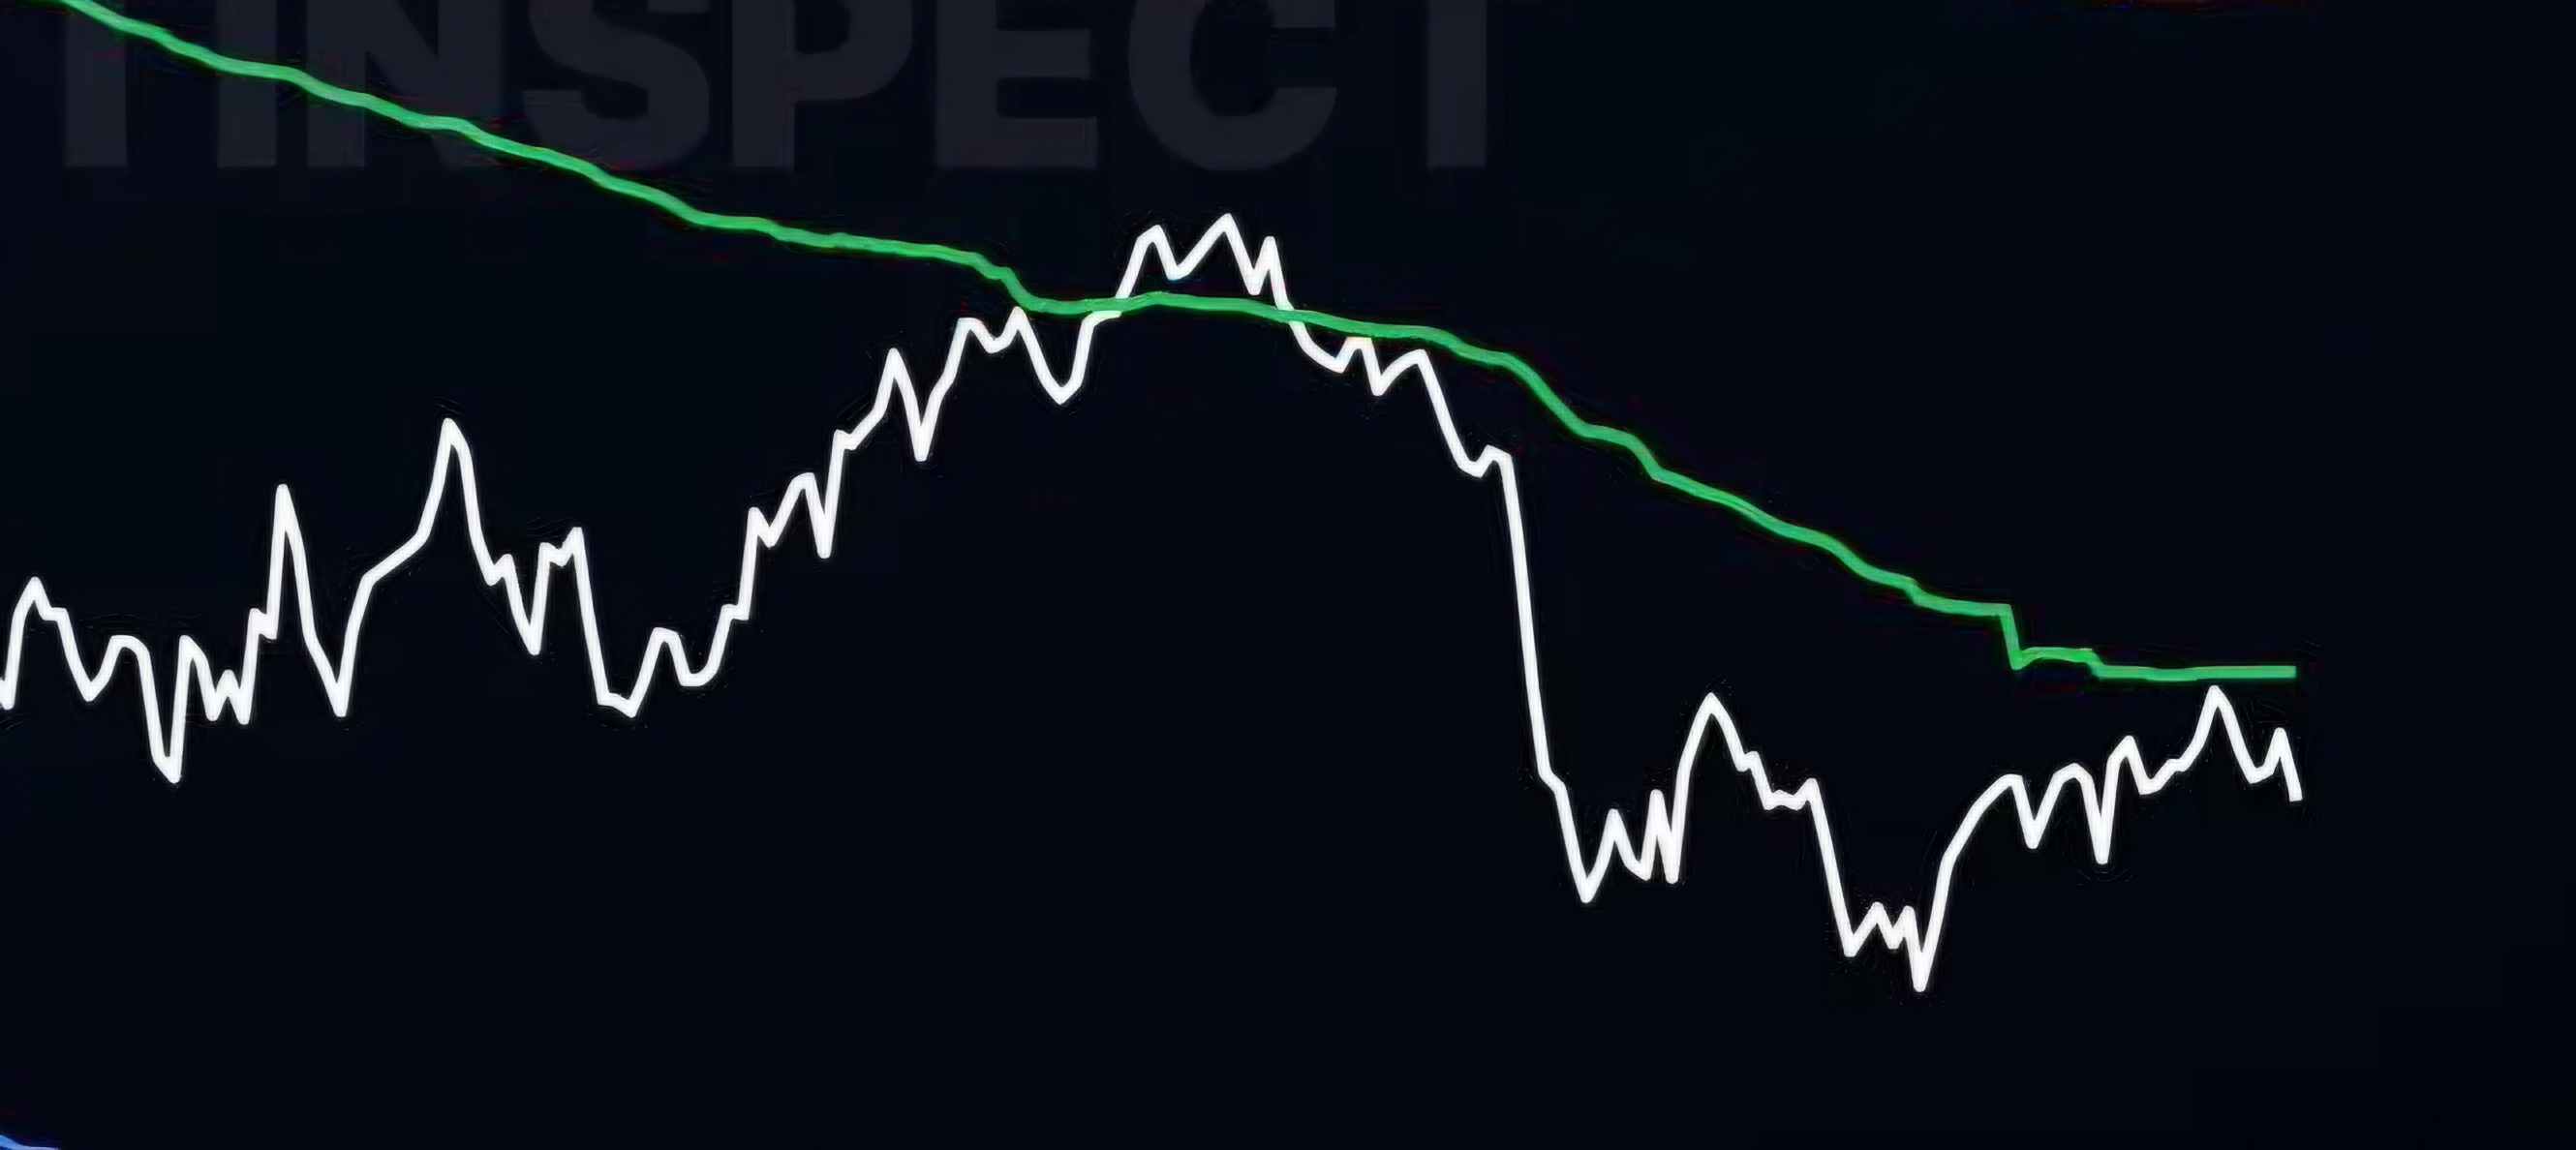
This is $BTC the moving average line of the average holding price of current short-term holders. It can be seen that the moving average has gradually flattened. The drop from last night may have touched some short-term holders’ average prices, leading to selling pressure.
Review the trend of 2019.
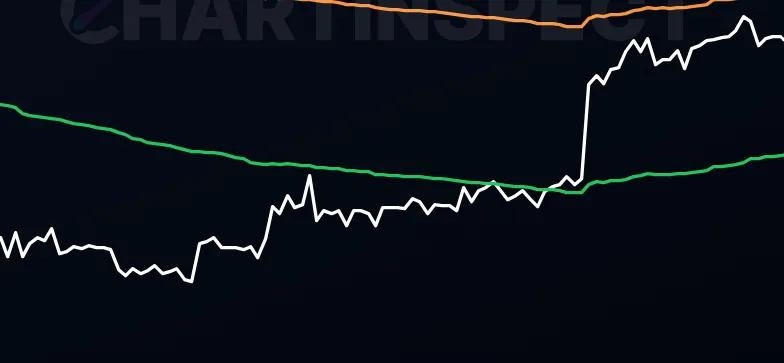
As can be seen, in 2019 Bitcoin surged with unusually high volume when it touched the average line for short-term holders, and the moving average still had a certain slope during this process.
Next, we look at Bitcoin’s trend in 2022.
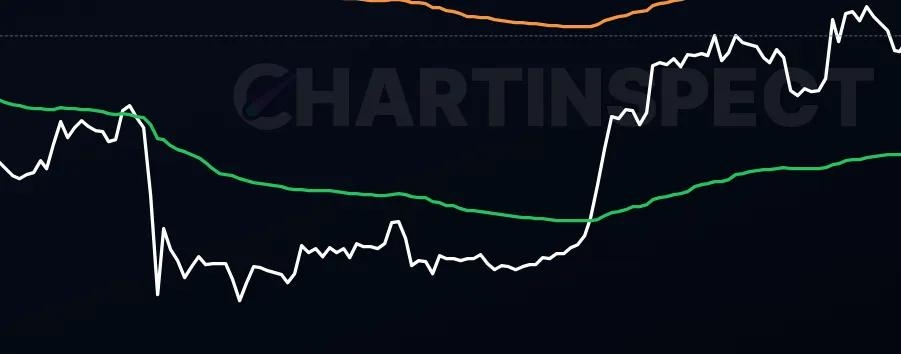
You can see that Bitcoin stays tightly close to the short-term holders’ moving average, and the process of slowly flattening that moving average also suddenly saw a surge in volume.
Return to the current trend
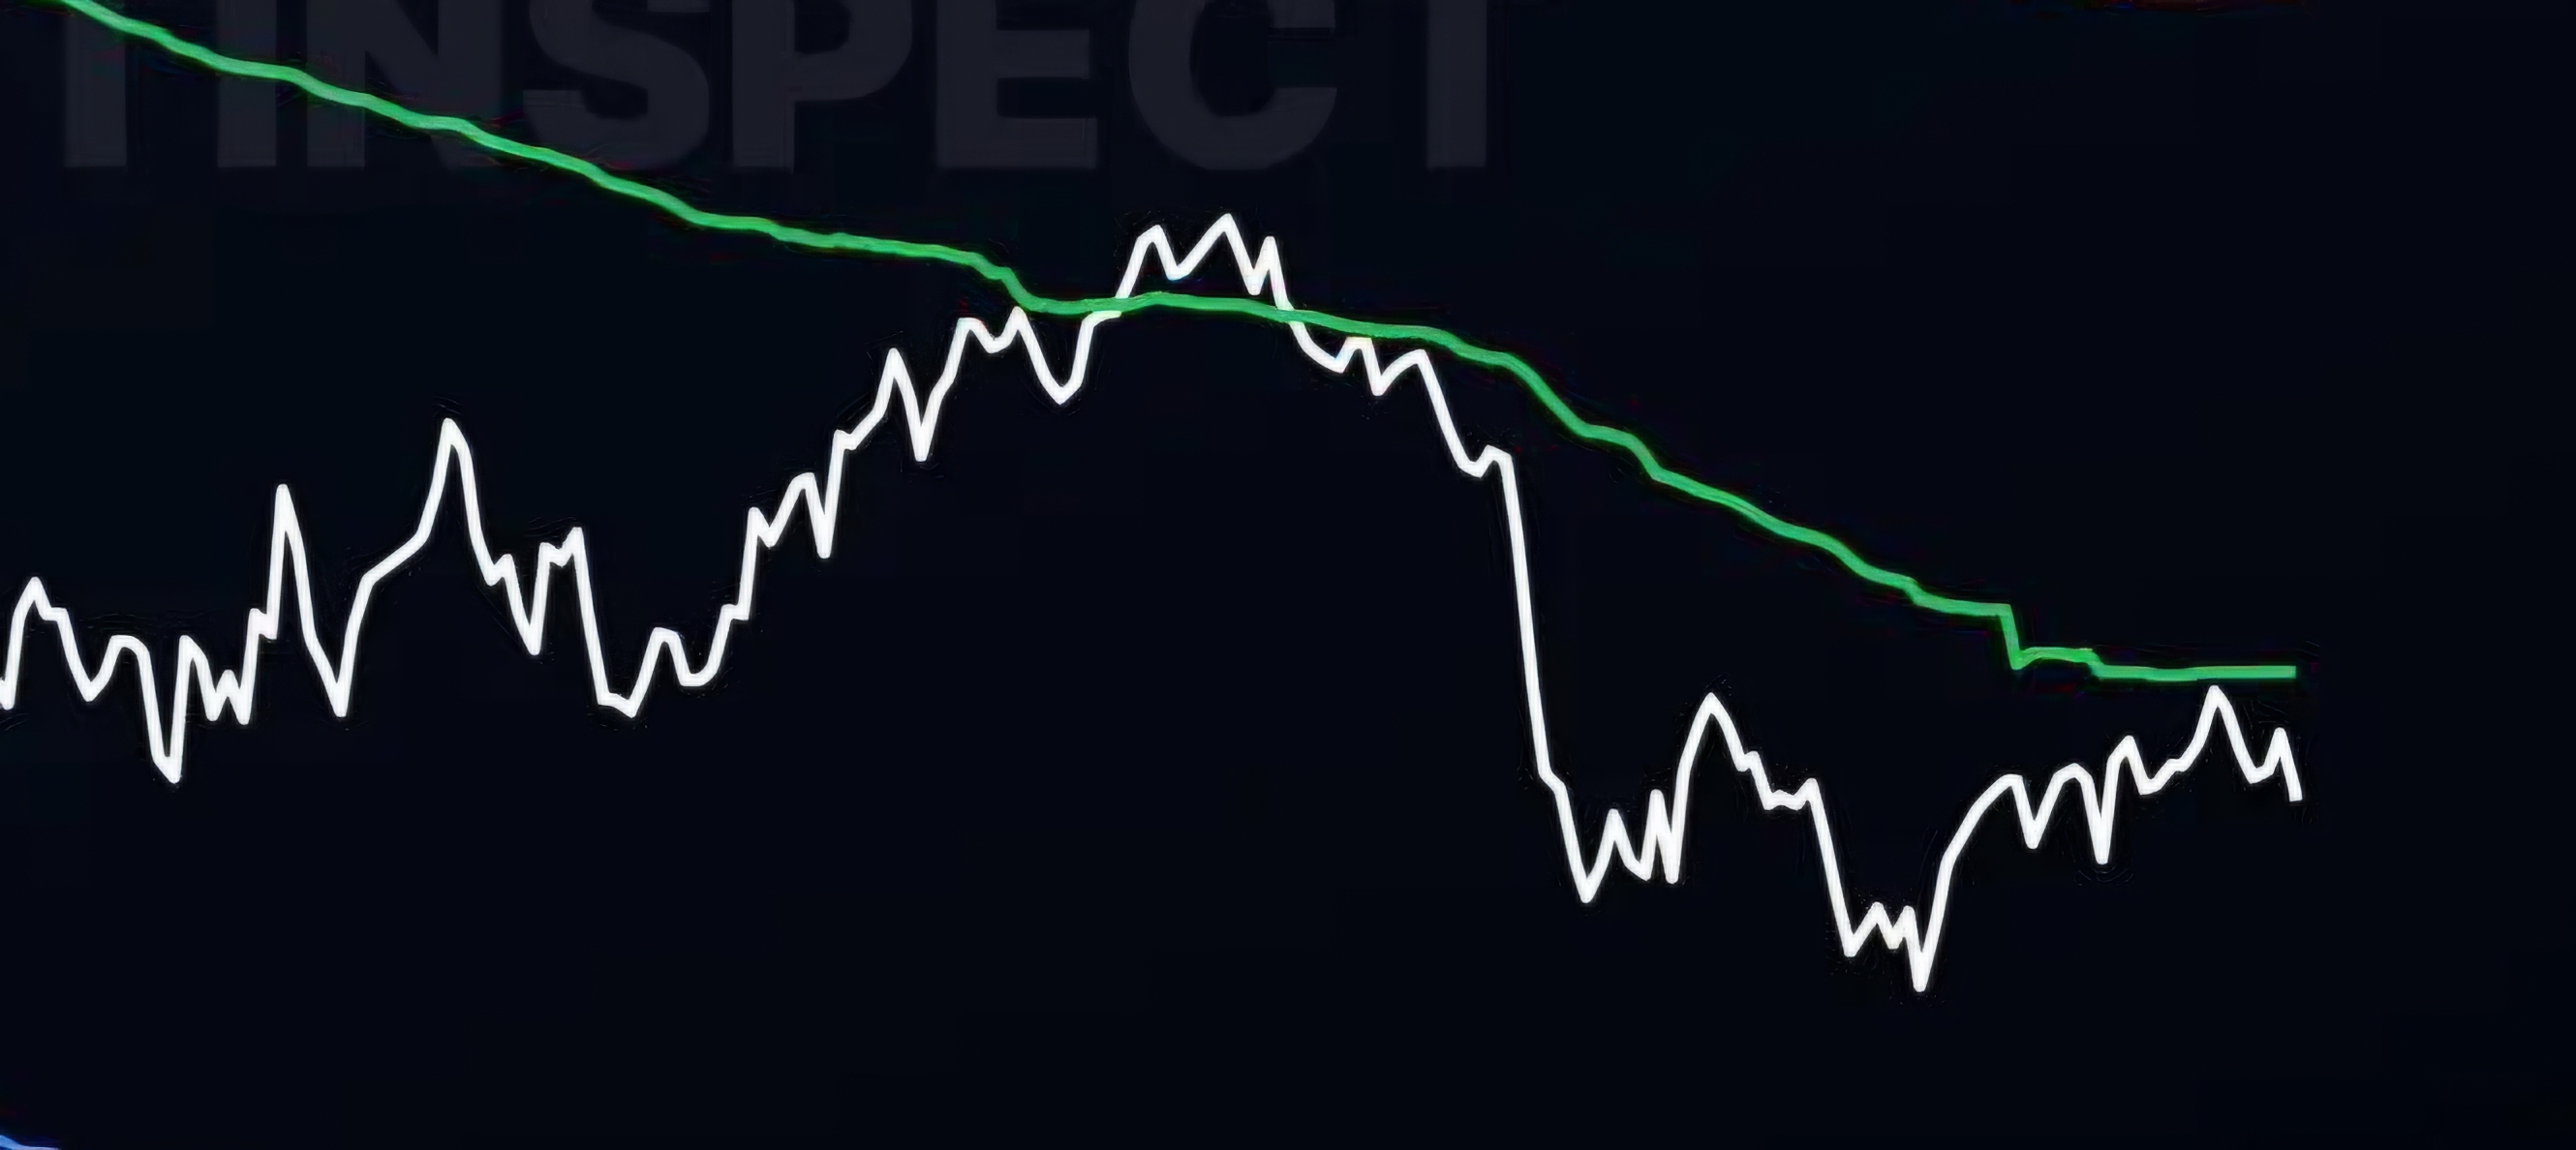
This structure clearly shows that compared with the market trends in 2019 and 2022, the moving averages are smoother and nearly parallel—could it be close to the eve of a big surge?
The above is only market observation. Going forward, various scenarios may occur. Choose the outcome you think is most likely, and be responsible for any decisions you make.