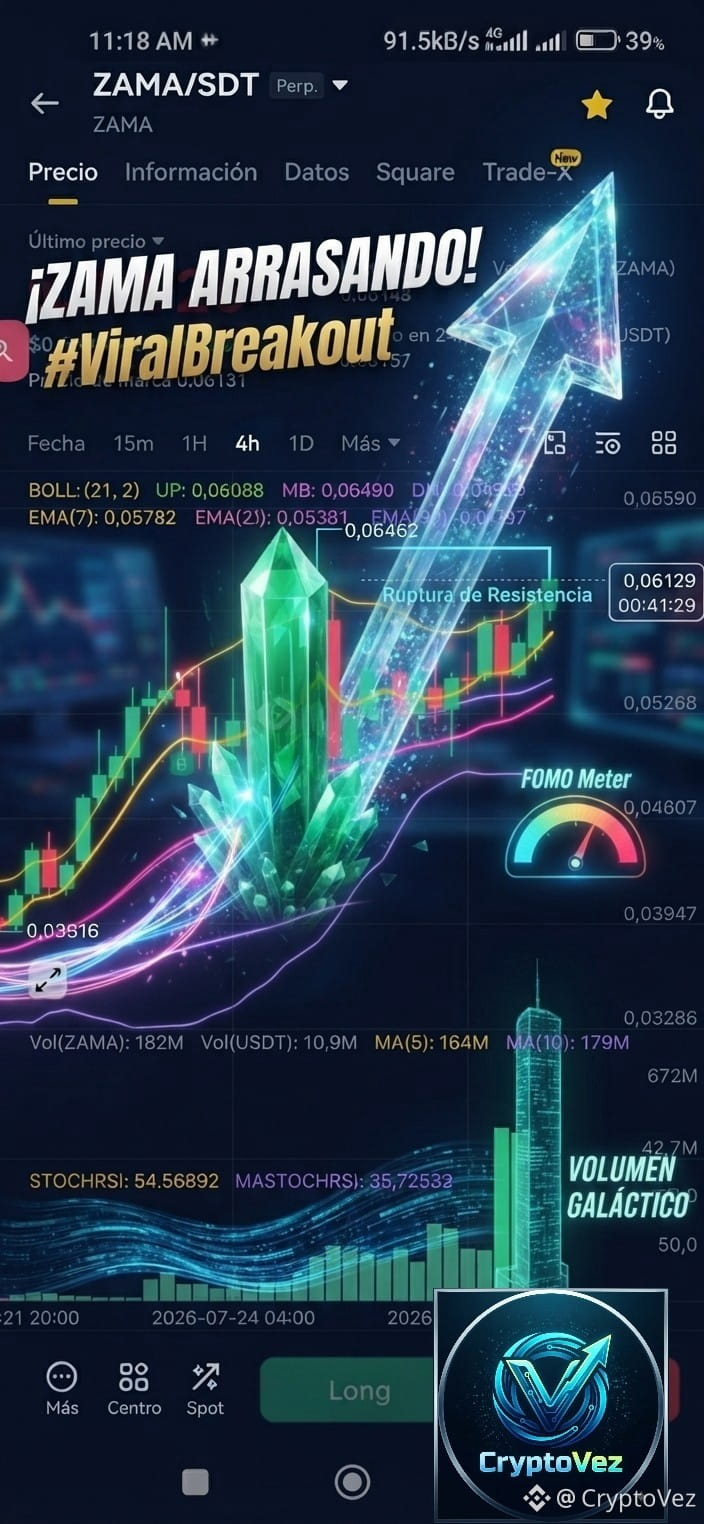
Does Zama break it or not break it? The key moment in ZAMA/USDT 🚀🔥
The ZAMA/USDT market on the 4-hour timeframe is at a point of maximum technical tension. Will it manage to break above its current ceiling, or will we see a surprising rejection? Let’s break it down! 📊
Key Technical Analysis
Current Price: Trading at 0.06129, directly piercing the Upper Bollinger Band (UP at 0.06088), which reflects a strong short-term buying impulse.
Moving Average Structure (EMA): The EMAs (7 and 25) maintain a solid upward slope and sit below the price, supporting the current buying pressure.
Resistance to Overcome: The immediate goal for the bulls is to power through the prior swing high located at 0.06462.
What to Expect from the Move?
⚡ To confirm a clean breakout above the ceiling, an increase in trading volume is essential to validate the move. Otherwise, if buying strength weakens in this resistance zone, the price could seek a technical pullback toward the middle band (MB at 0.05490) to gather momentum.
📉 Do you think volume will back up this candle to break the highs, or are you expecting a retest? Let me know in the comments! 👇
#ZAMA #CryptoTrading #AnalisisTecnico #Altcoins #TradingDeCriptos #BinanceSquare #Web3
$ZAMA
The ZAMA/USDT market on the 4-hour timeframe is at a point of maximum technical tension. Will it manage to break above its current ceiling, or will we see a surprising rejection? Let’s break it down! 📊
Key Technical Analysis
Current Price: Trading at 0.06129, directly piercing the Upper Bollinger Band (UP at 0.06088), which reflects a strong short-term buying impulse.
Moving Average Structure (EMA): The EMAs (7 and 25) maintain a solid upward slope and sit below the price, supporting the current buying pressure.
Resistance to Overcome: The immediate goal for the bulls is to power through the prior swing high located at 0.06462.
What to Expect from the Move?
⚡ To confirm a clean breakout above the ceiling, an increase in trading volume is essential to validate the move. Otherwise, if buying strength weakens in this resistance zone, the price could seek a technical pullback toward the middle band (MB at 0.05490) to gather momentum.
📉 Do you think volume will back up this candle to break the highs, or are you expecting a retest? Let me know in the comments! 👇
#ZAMA #CryptoTrading #AnalisisTecnico #Altcoins #TradingDeCriptos #BinanceSquare #Web3
$ZAMA