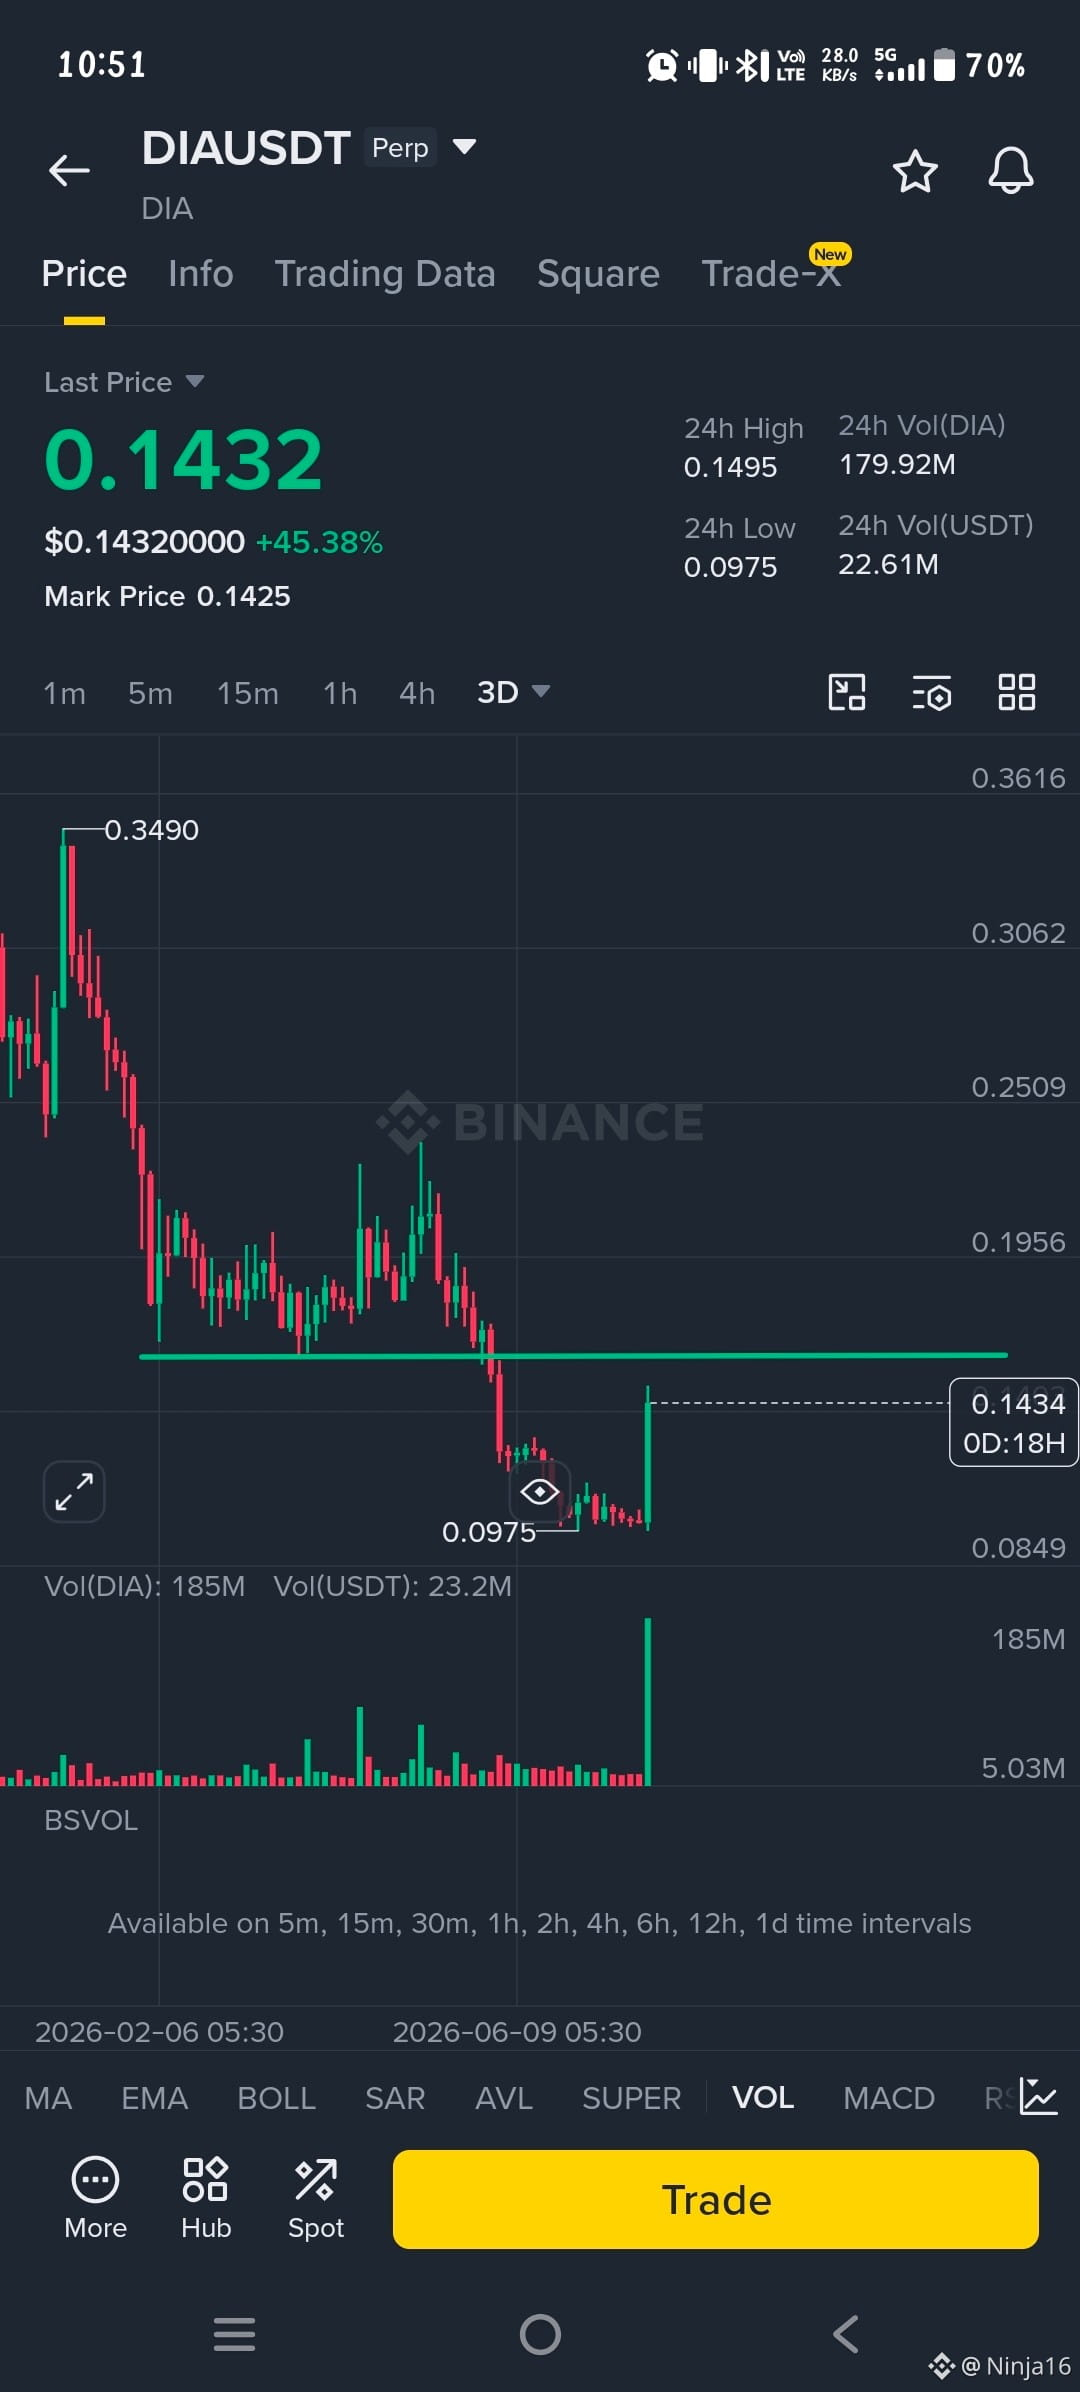
🚀 $DIA Pumping +45%! Bullish Reversal or Trap Before $0.1956? 🛑
DIA ($DIA ) just exploded with a massive +45.38% green candle on the 3-Day chart, reaching $0.1432 after touching a low of $0.0975. Volume is surging over 179M DIA ($22.6M USDT)!
But the big question every trader is asking right now: Is this the beginning of a macro bull run, or a liquidity sweep to dump on late buyers? 🤔
🔍 Technical Breakdown & Key Levels
🛡️ The Demand Floor: $0.0975 – $0.1000 (Bouncing strongly off macro support).
🎯 First Major Resistance: $0.1956 (Previous support that will now act as supply).
🚀 Macro Moon Level: $0.2509 – $0.3490.
If $DIA closes above $0.1500 on high volume, it signals buyers are absorbing all sell pressure before testing $0.1956. However, chasing a vertical move without waiting for a retest increases your risk.
Will you buy the breakout now or wait for the dip?
👇 Monitor the live chart in real-time and execute your trades below:
$DIA #DIAUSDT #Dia
DIA ($DIA ) just exploded with a massive +45.38% green candle on the 3-Day chart, reaching $0.1432 after touching a low of $0.0975. Volume is surging over 179M DIA ($22.6M USDT)!
But the big question every trader is asking right now: Is this the beginning of a macro bull run, or a liquidity sweep to dump on late buyers? 🤔
🔍 Technical Breakdown & Key Levels
🛡️ The Demand Floor: $0.0975 – $0.1000 (Bouncing strongly off macro support).
🎯 First Major Resistance: $0.1956 (Previous support that will now act as supply).
🚀 Macro Moon Level: $0.2509 – $0.3490.
If $DIA closes above $0.1500 on high volume, it signals buyers are absorbing all sell pressure before testing $0.1956. However, chasing a vertical move without waiting for a retest increases your risk.
Will you buy the breakout now or wait for the dip?
👇 Monitor the live chart in real-time and execute your trades below:
$DIA #DIAUSDT #Dia