


Audiera [BEAT] is trading around a valuation level of nearly $970 million after its market cap rose 17%.
The BEAT rally is set to carry into the weekend, with technical signals still supporting an upward trend, but liquidation zones and overhead resistance thresholds may still create counterpressure.
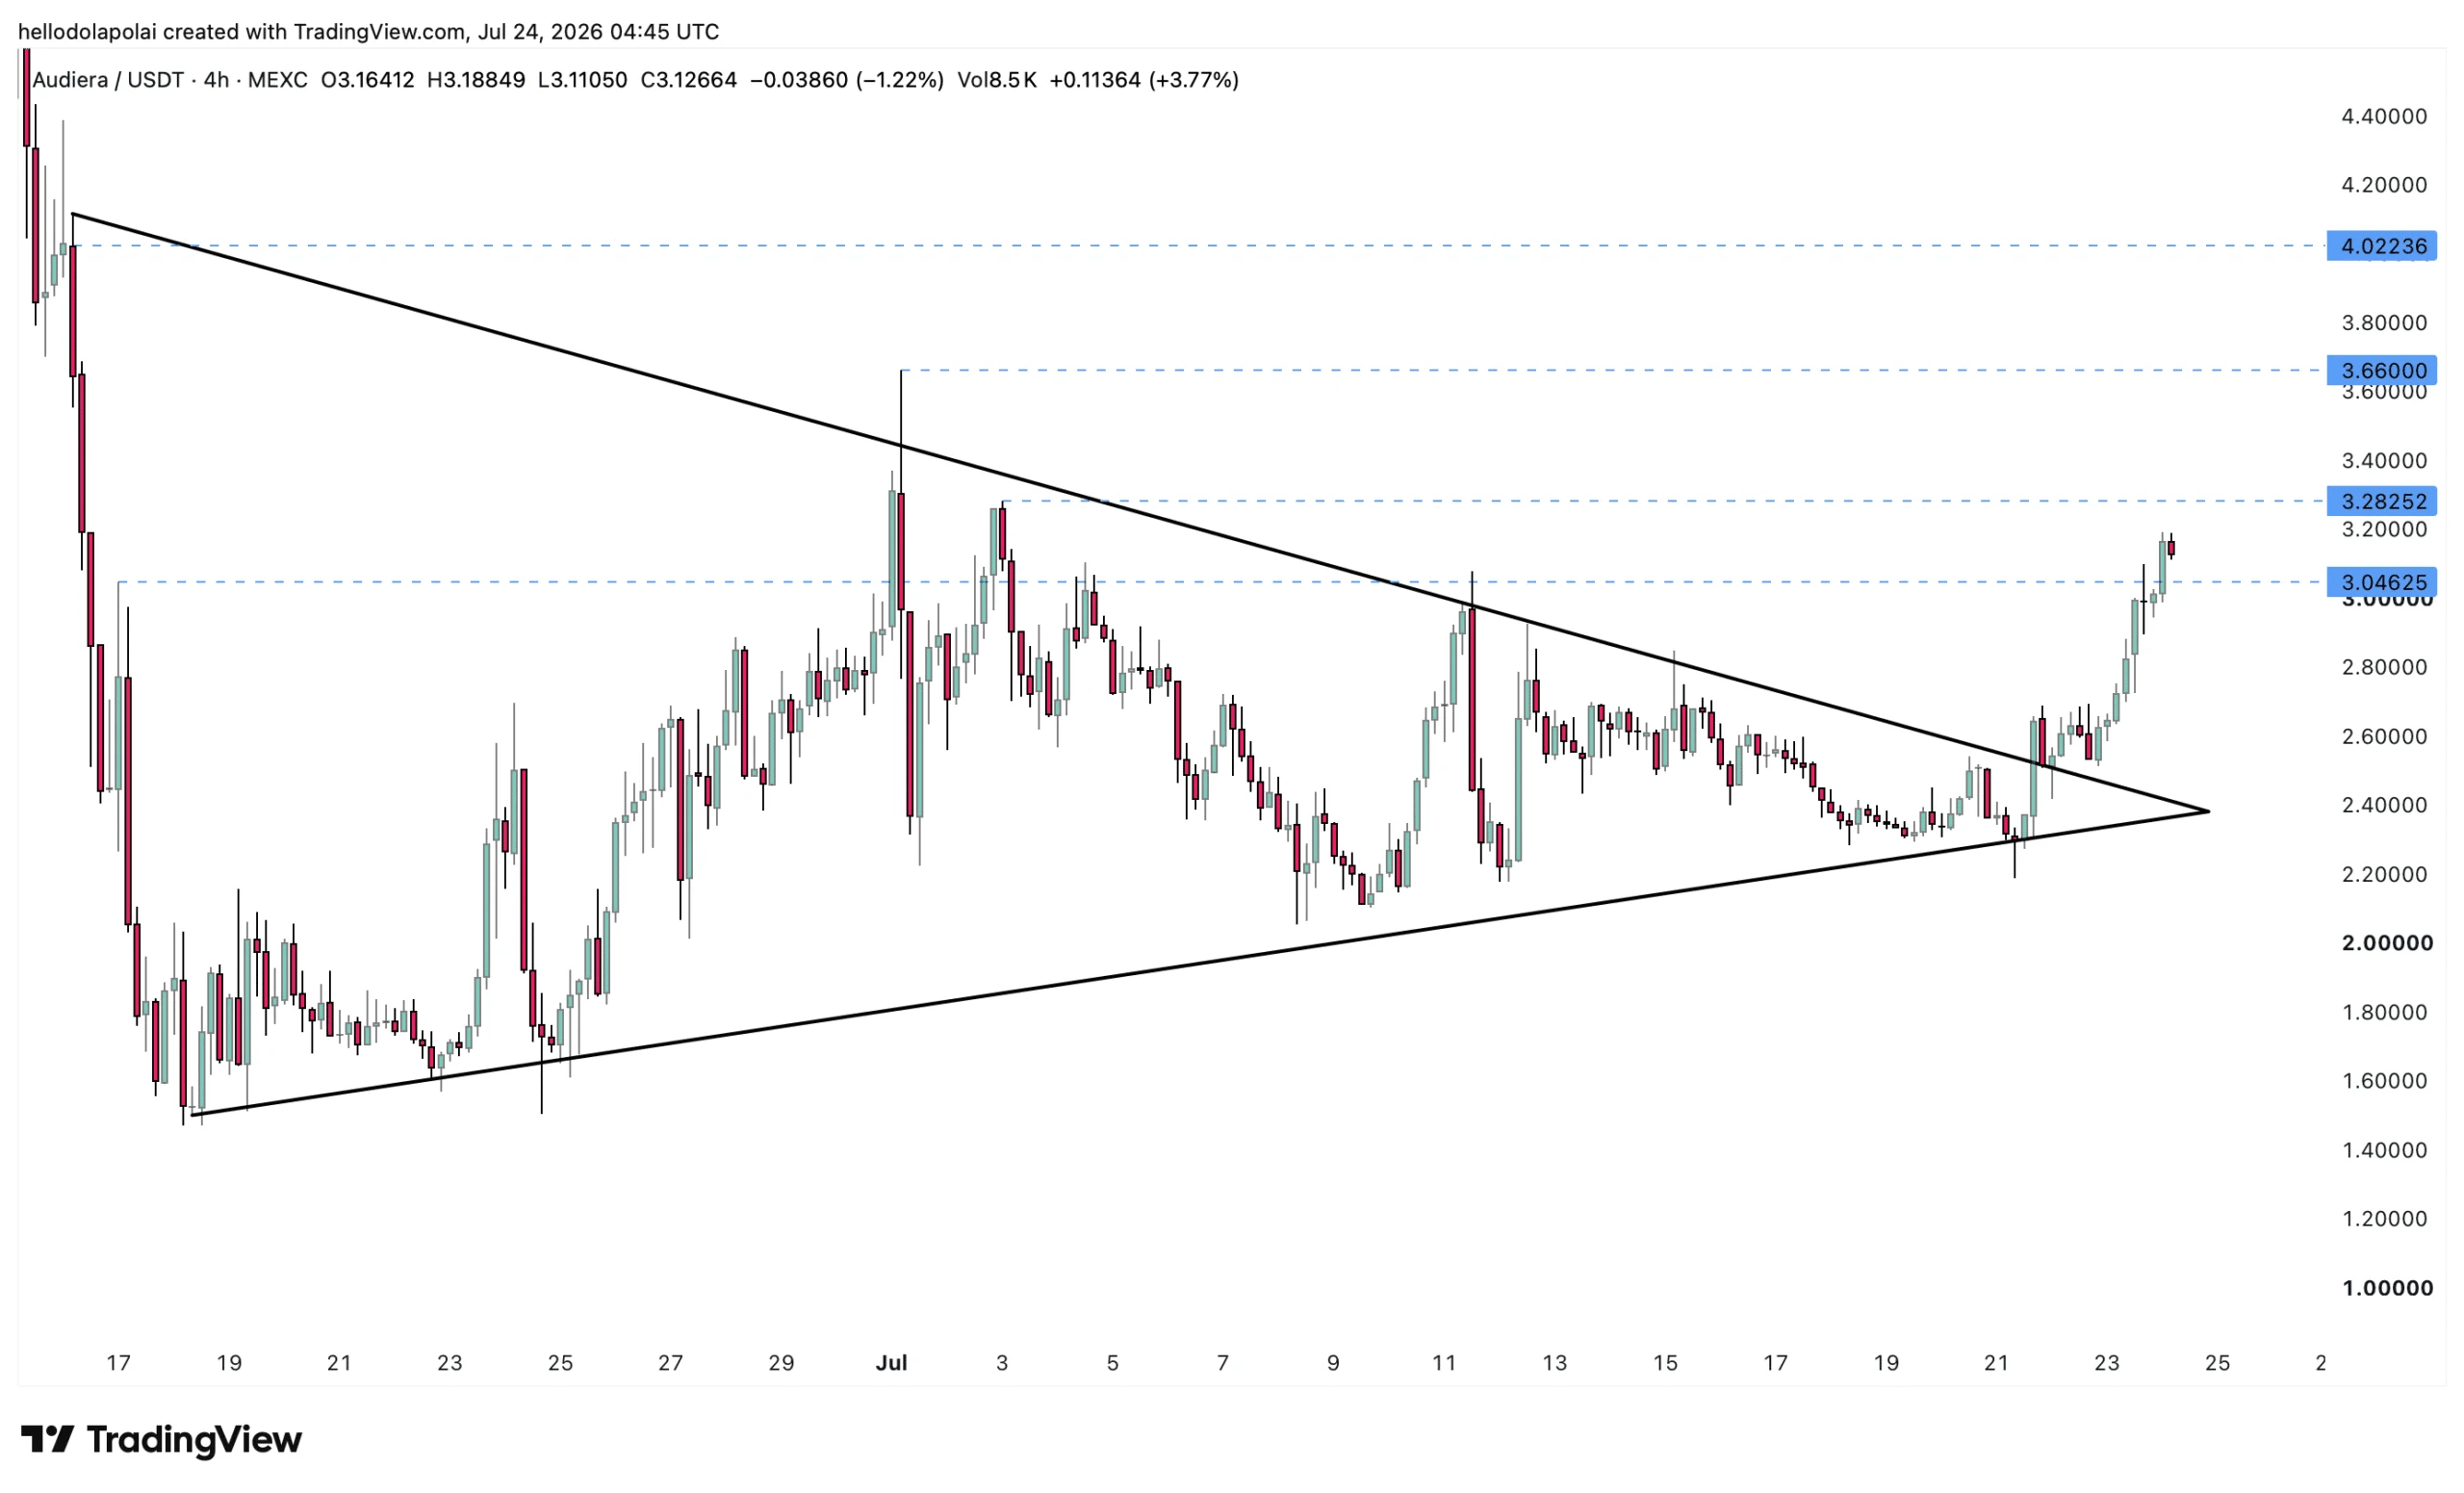
BEAT has just broken out of a rising triangle pattern
BEAT has broken out of a rising triangle pattern on the 4-hour chart—a structure often associated with a continuation trend. If the upmove holds, the technical measurement target zone is $4.
On the way up, BEAT needs to break above $3.2 and then $3.6 before moving closer to the higher target. Trading volume also supports the bullish move, with a rise of 82% to $32.87 million.
This development shows that buying pressure is still present, but the upward run ahead is not yet completely smooth. Short-term resistance levels will determine whether the price can sustain the breakout momentum.
 Source: TradingView
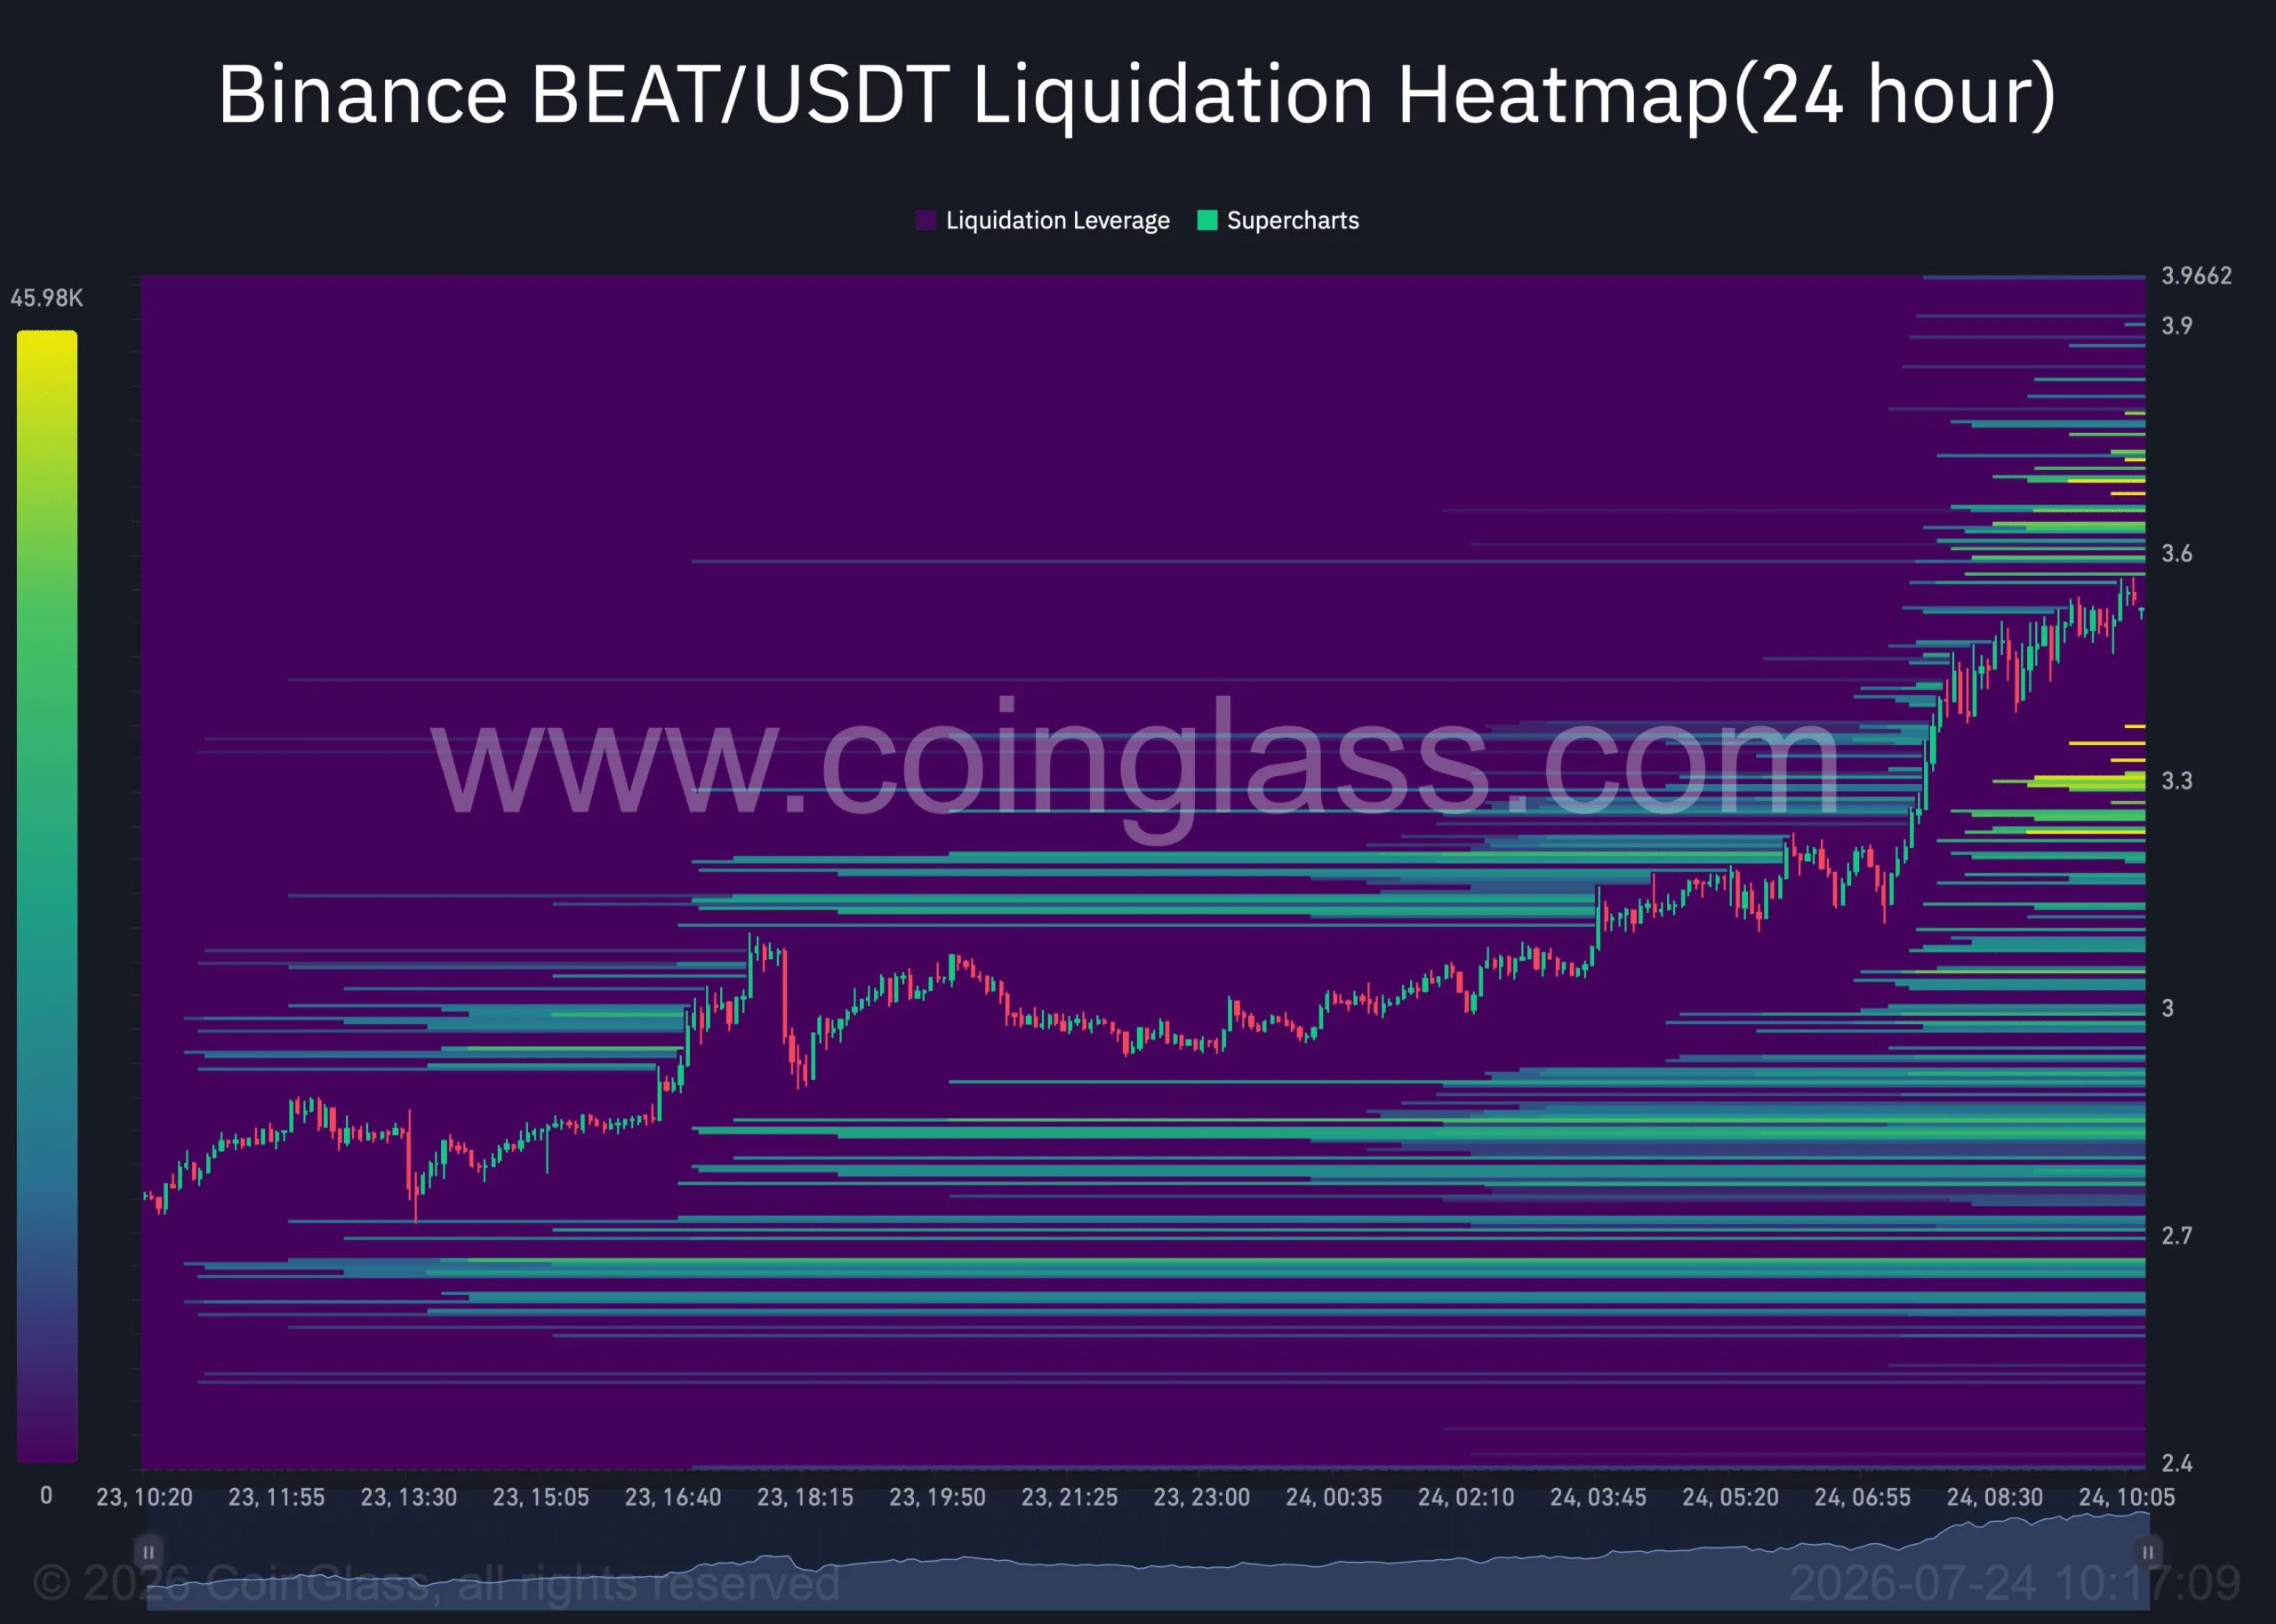
Liquidation concentrated below the current price increases the risk of a correction
The liquidation chart shows that greater risk lies below BEAT’s current price. Heavier liquidity clusters underneath could pull the price down if the upward momentum weakens.
On the upside, order clusters still exist but are thinner and shorter, so the room to extend the rally may be limited. This creates a fragile balance between the upside target and the risk of a quick reversal.
The current trading position still leans toward an uptrend, as sell orders betting on lower prices are taking losses of about $488,910, while the buyers are down about $98,510.
 Source: CoinGlass
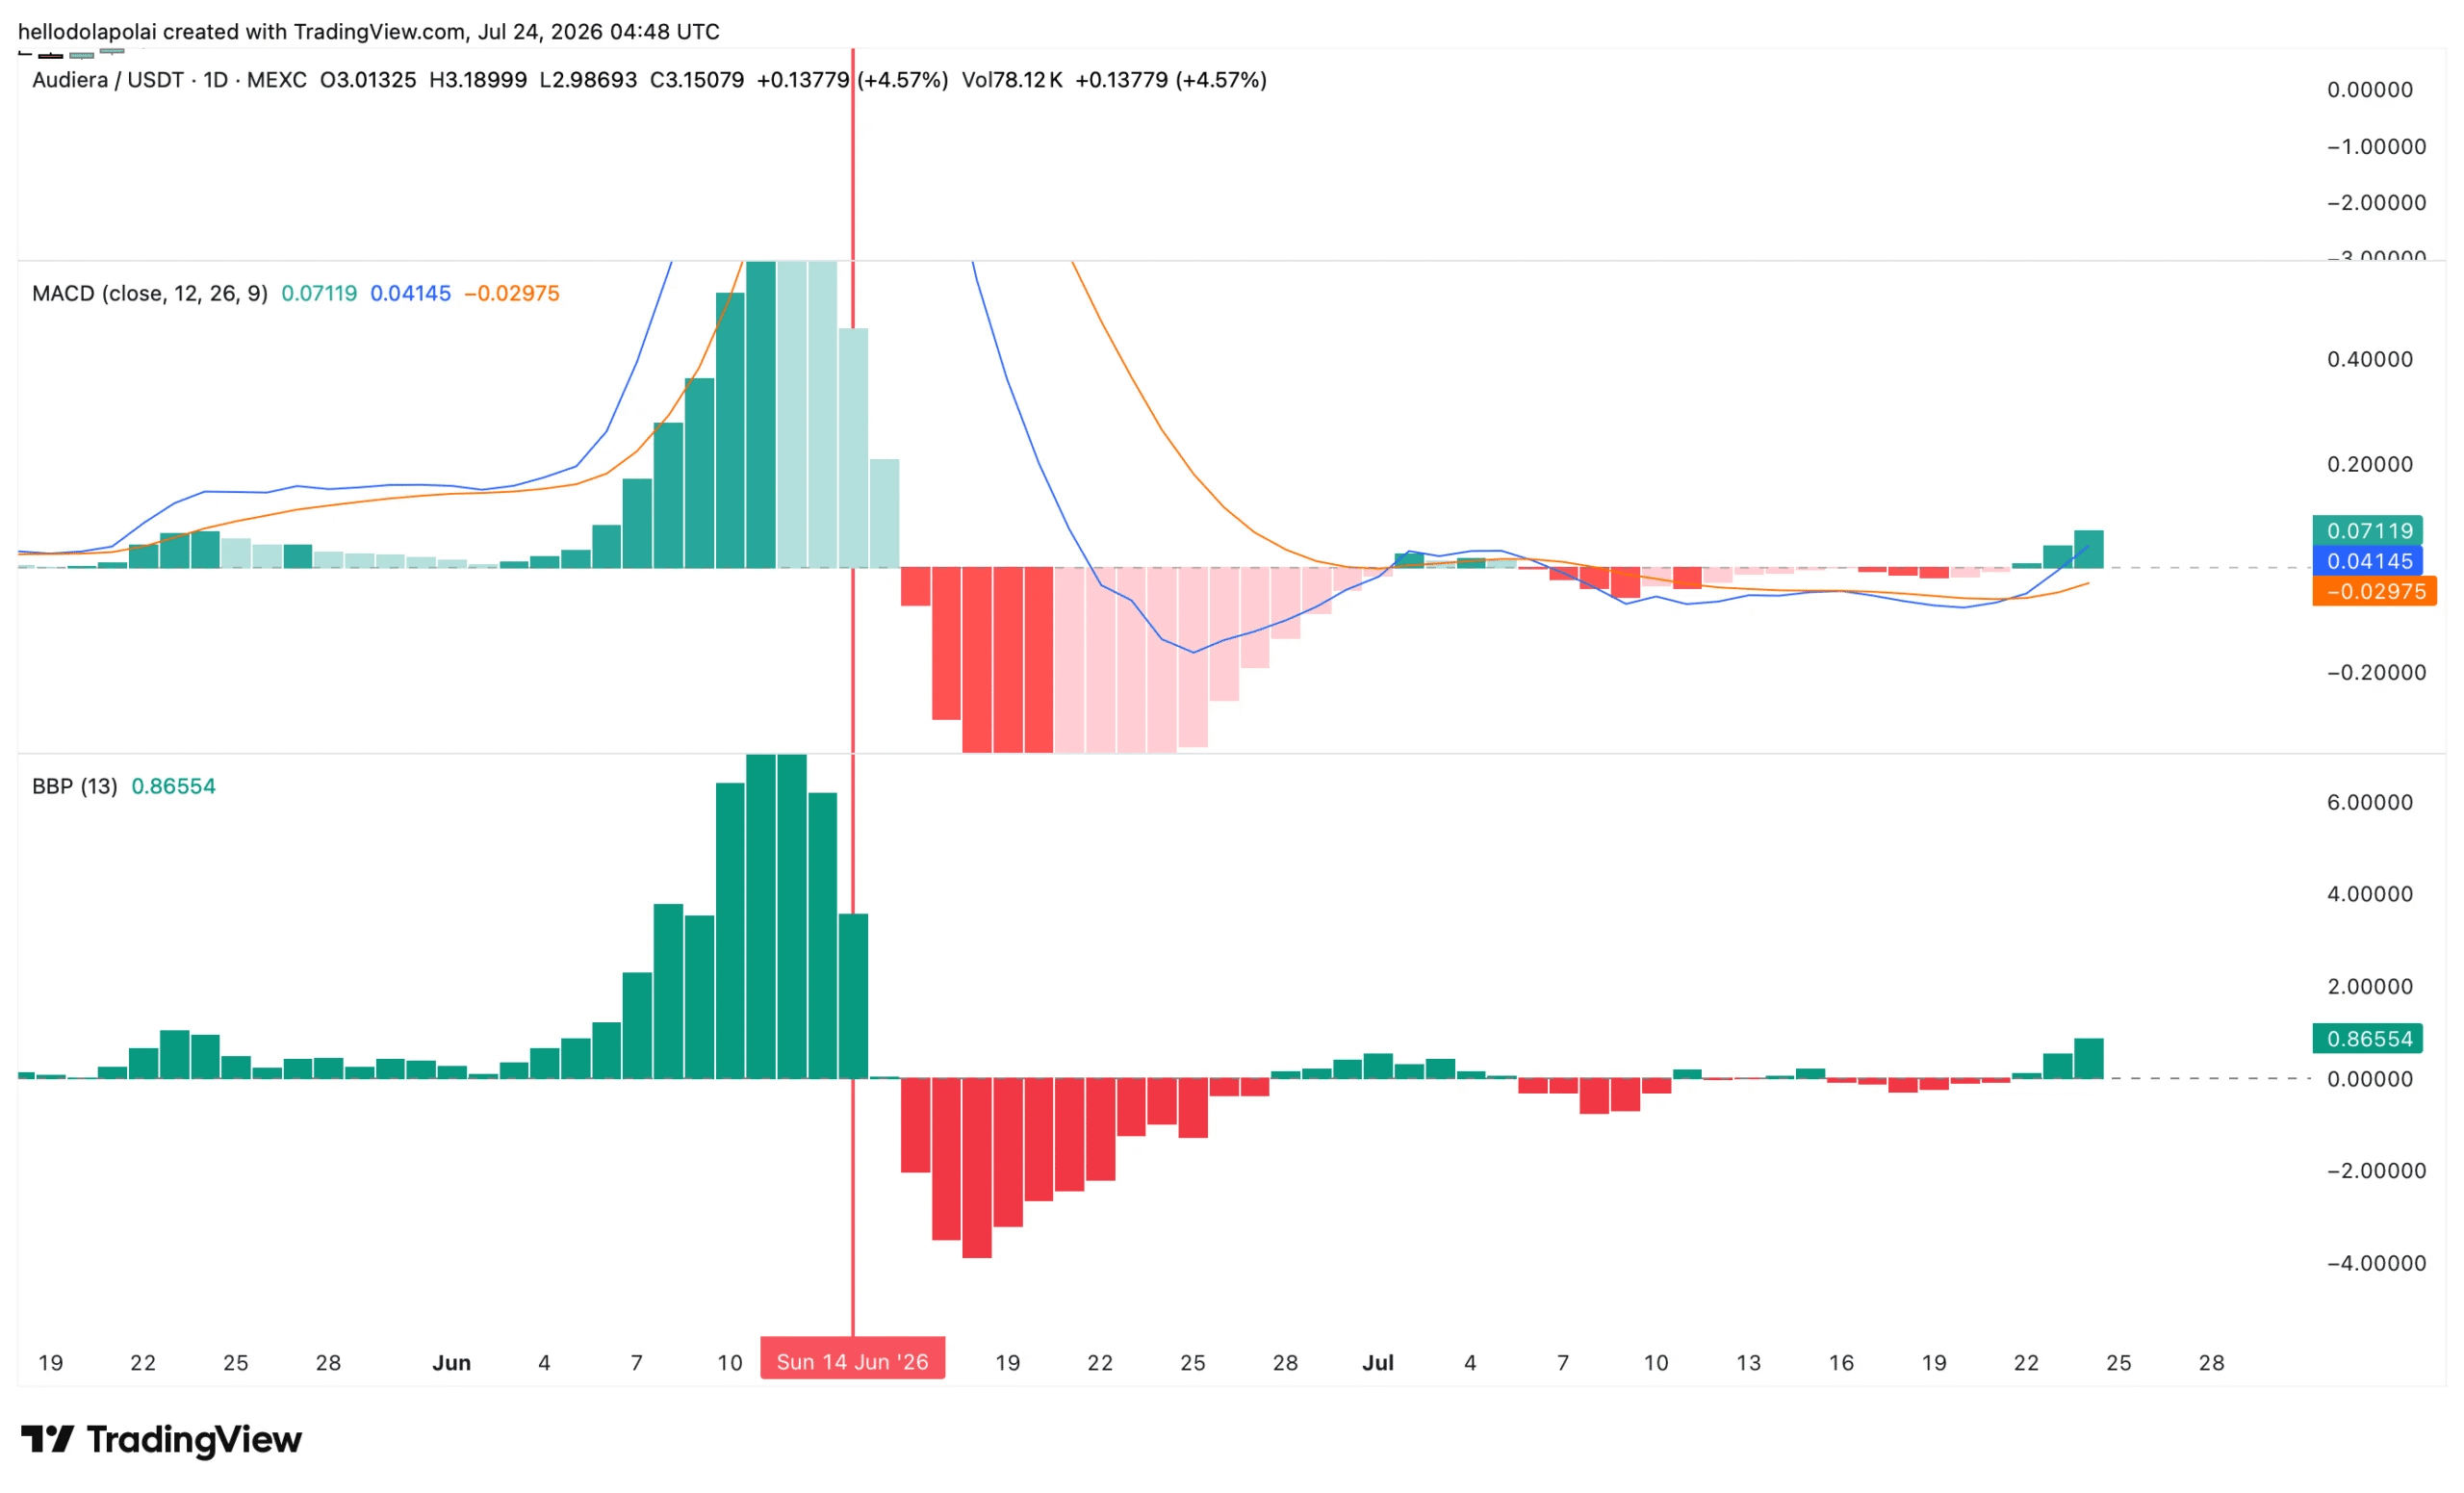
MACD and Bull Bear Power still lean toward the buy side
BEAT is receiving positive signals from momentum indicators, suggesting that the short-term bearish scenario is not yet dominant. The MACD has crossed above the signal line for the first time since early July.
Bull Bear Power further reinforces this picture as the bulls return stronger, with the highest reading since June 14. That implies buyers can likely hold prices above the current levels for longer.
That said, momentum indicators do not completely eliminate the risk of an opposite move. If buying pressure weakens, the liquidity clusters below could pull the price down faster than expected.
 Source: TradingView
Summary
BEAT currently has a positive technical foundation, with an ascending triangle breakout, improving trading volume, and momentum indicators leaning toward the buy side. However, the overhead resistance zone and the liquidity cluster below are still two factors that could change the price action in the short term.
Source: https://tintucbitcoin.com/breakout-audiera-co-the-dua-beat-len-4-usd/
Thank you all for reading this article!
Like, Comment, and Follow TinTucBitcoin to stay updated with the latest news about the cryptocurrency market and not miss any important information!
$BTC $ETH $BNB $XRP $SOL