
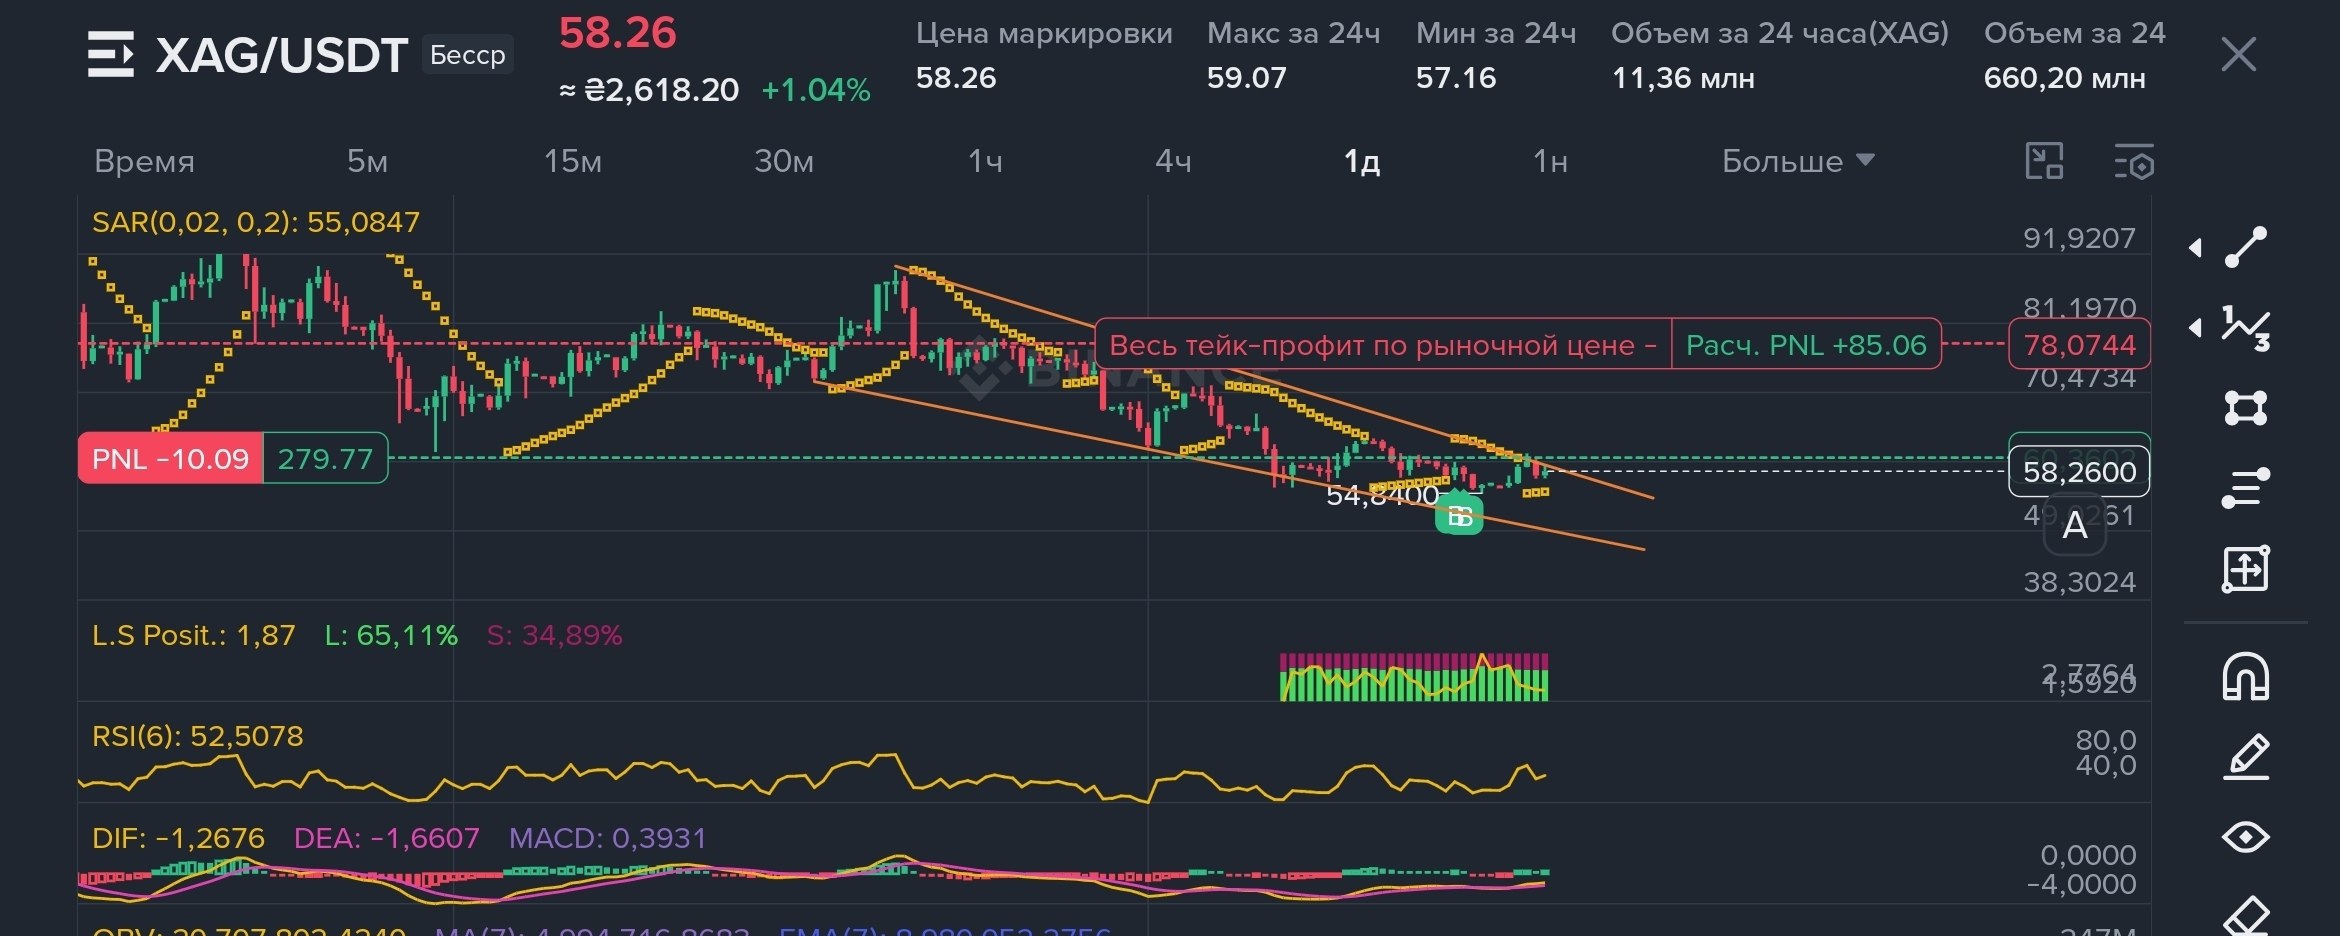

On the chart, the medium-term trend remains
a downtrend, but the first signs of stabilization have appeared.
What I see on the chart:
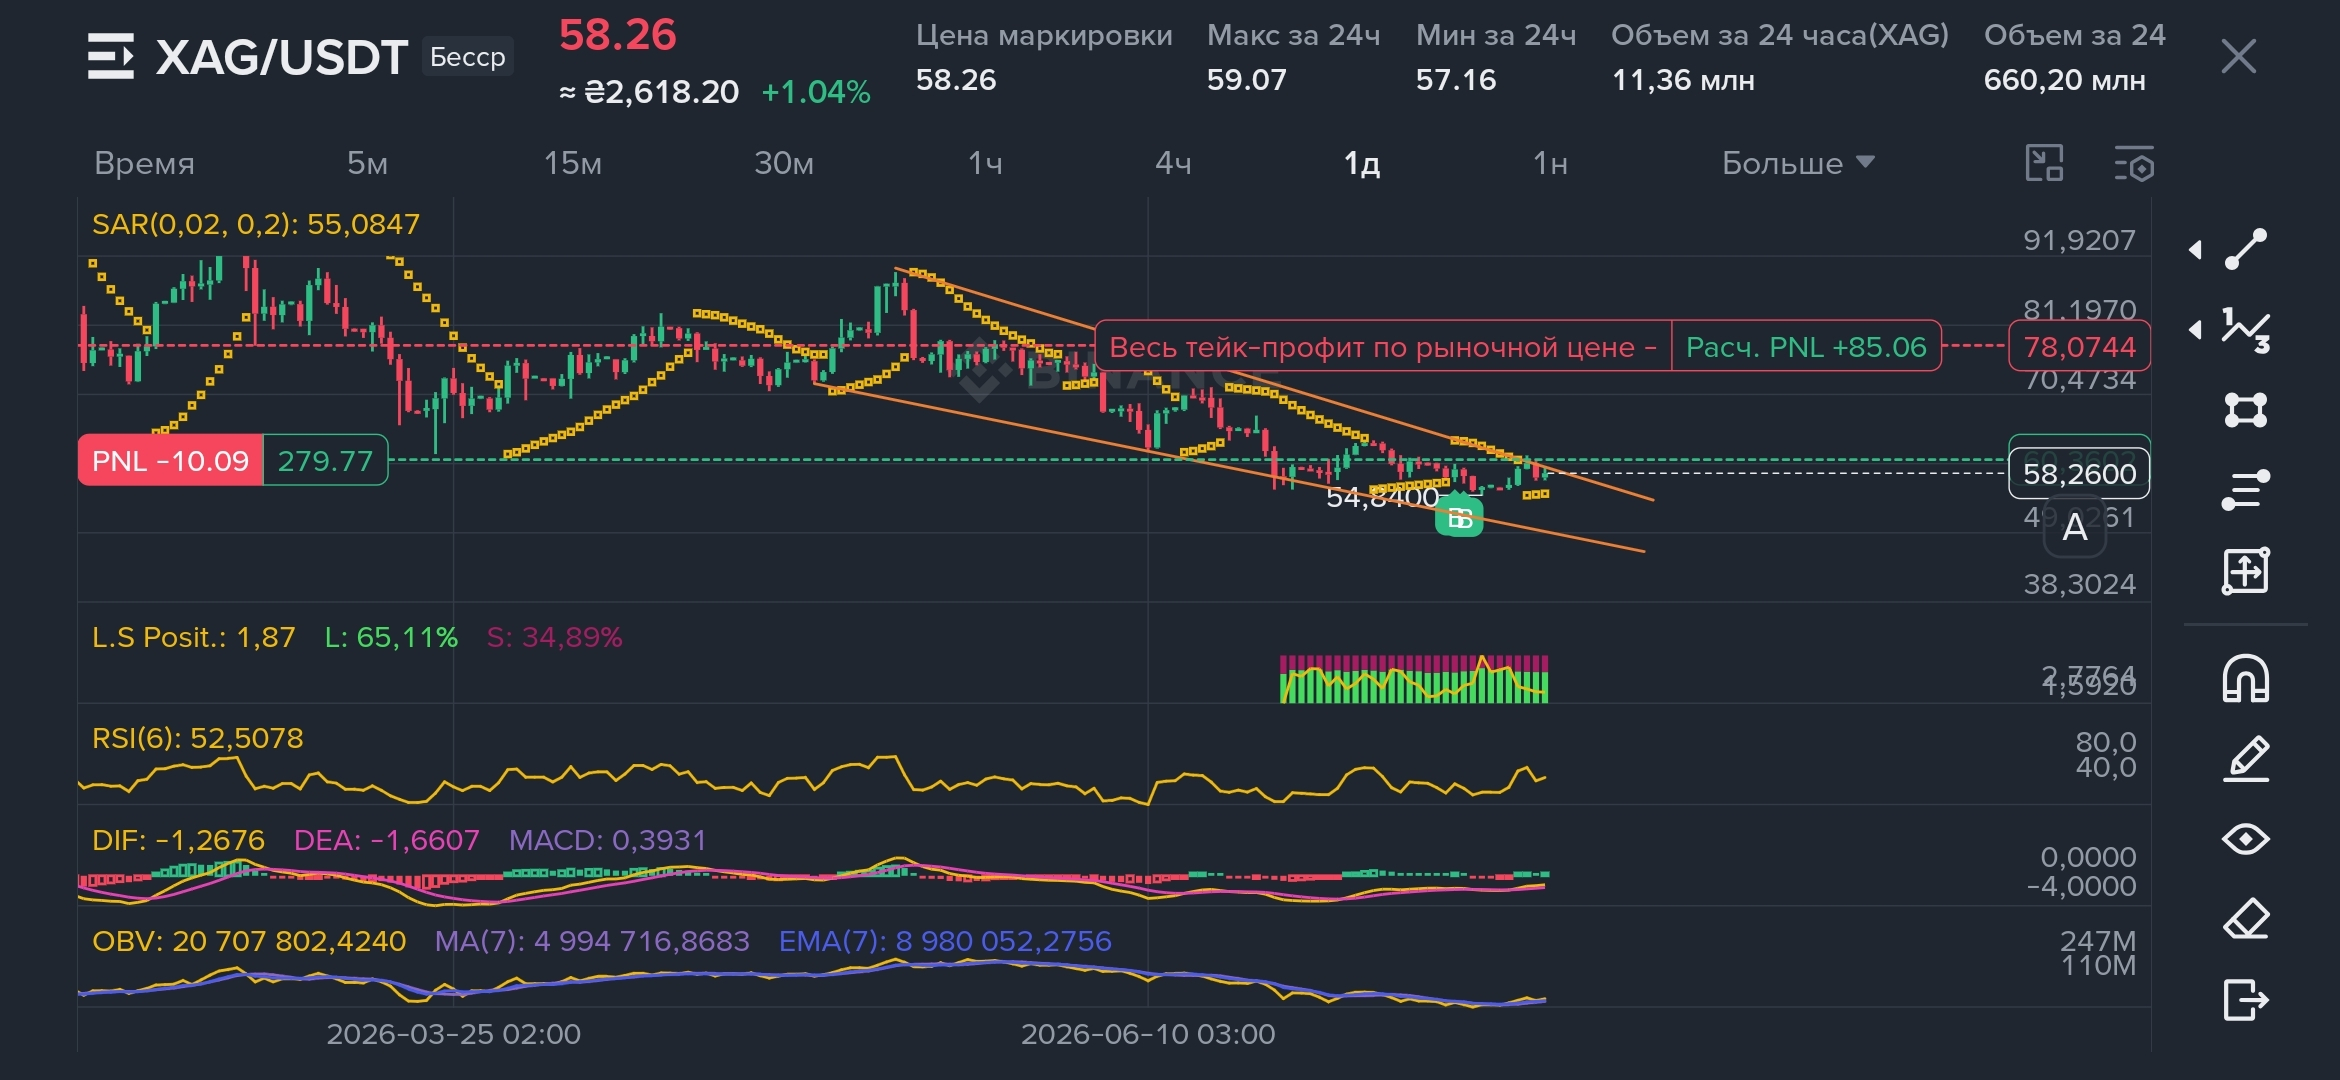
Price continues to move within a downtrend channel, but it is near its lower boundary.
A rebound occurred from the 54.8–55.0 zone, where a buyer appeared.
Parabolic SAR is already below the price — this is an early signal of a possible reversal of the local impulse upward.
RSI(6) ≈ 52 — the indicator has exited the weakness zone and is above the neutral level. There is still room for upside.
MACD is starting to turn upward: the histogram is becoming positive, and the lines are converging. This confirms a weakening of bearish pressure.
OBV currently does not show a strong inflow of capital, so an upward move needs confirmation by volumes.
Key levels
Support: 57.2–58.0.
Next major resistance: 60–62, then the upper boundary of the channel.
Conclusion The setup looks like an attempt to form a local bottom after a prolonged decline. At this stage, it’s more of a technical rebound than a full trend reversal. A break and close above the top boundary of the channel would significantly increase the likelihood of a move toward 62–65. Losing the 57–58 zone would open the way for a retest of 55.
Overall, the probability of continuing the recovery move is currently higher than a few days ago; however, confirmation must come through rising volume and a confident breakout out of the downtrend channel.