

A little theory on technical analysis.
What is even going on with this chart?
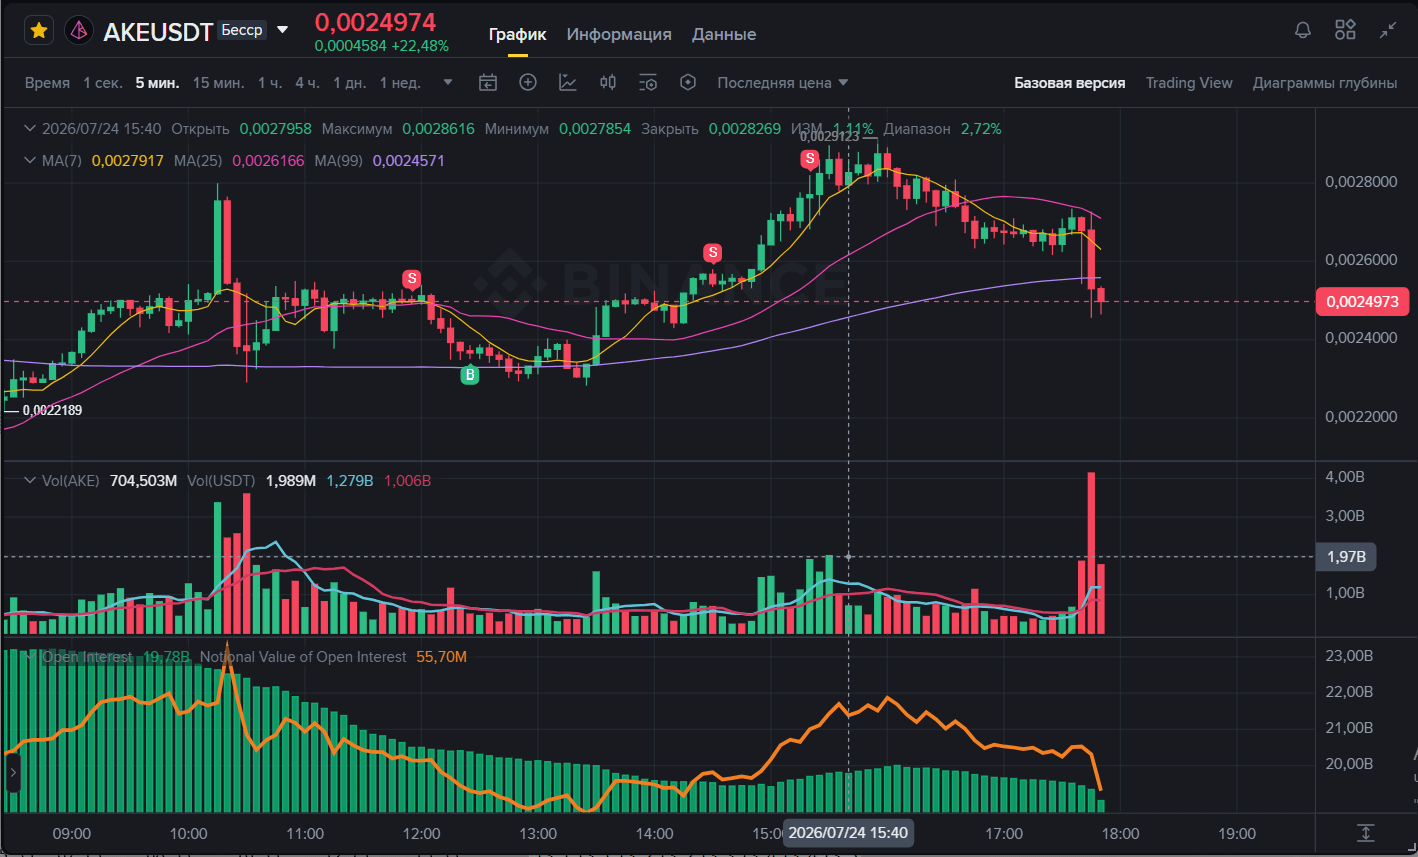
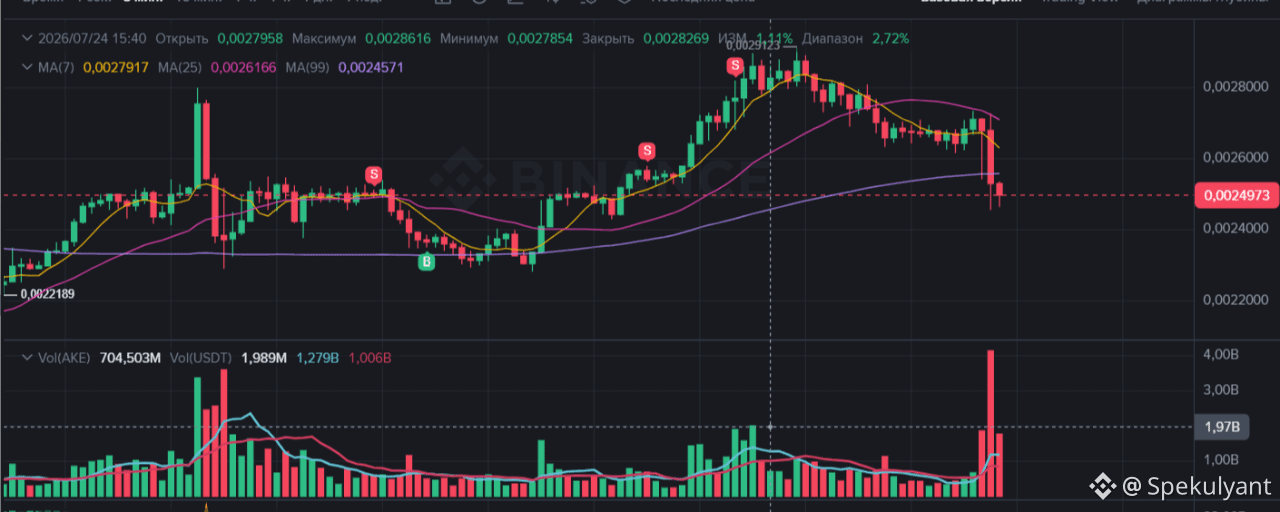
In front of us is a 5-minute futures chart for the AKE/USDT pair. It shows:
Candles show how the price changed every 5 minutes: green — the price increased during the period, red — it fell.
Moving averages (MA) are lines (yellow, purple, blue) that smooth out noise and help you see the trend. If the price is above the lines, people more often talk about an uptrend; if it’s below, a downtrend.
Volume — the bars at the bottom: the higher the bar, the more contracts were bought/sold over these 5 minutes.
Open Interest (OI) — the lower chart with green bars and an orange line: this is the total number of open (unclosed) futures contracts. Rising OI means new money is entering the market; falling OI means positions are being closed.
“OI is falling, volume is rising”—what does it mean
This is a classic situation where the market is “deleveraging”:
A fall in open interest indicates that traders are closing positions en masse. This can be profit-taking after a rise or exiting losing positions (for example, during liquidations).
Rising volume alongside falling OI means that position closures are happening actively: many trades, and lots of money is moving hands.
In simple terms: the “crowd” exits positions and does it quickly—hence the volume spikes. Often, this is a sign that the impulse is over and the market is switching to consolidation or a correction.
What do moving averages and price show
On the chart, you can see that the price first rose confidently and stayed above all the MAs, and then suddenly pulled back and is now below MA(7) and MA(25). This is a technical signal of weakening trend: the short-term impulse has run out, and the market may be looking for a new balance.
“The order book is full of orders to buy and to sell”
The order book shows intentions, not facts: it contains limit orders that have not been executed yet.
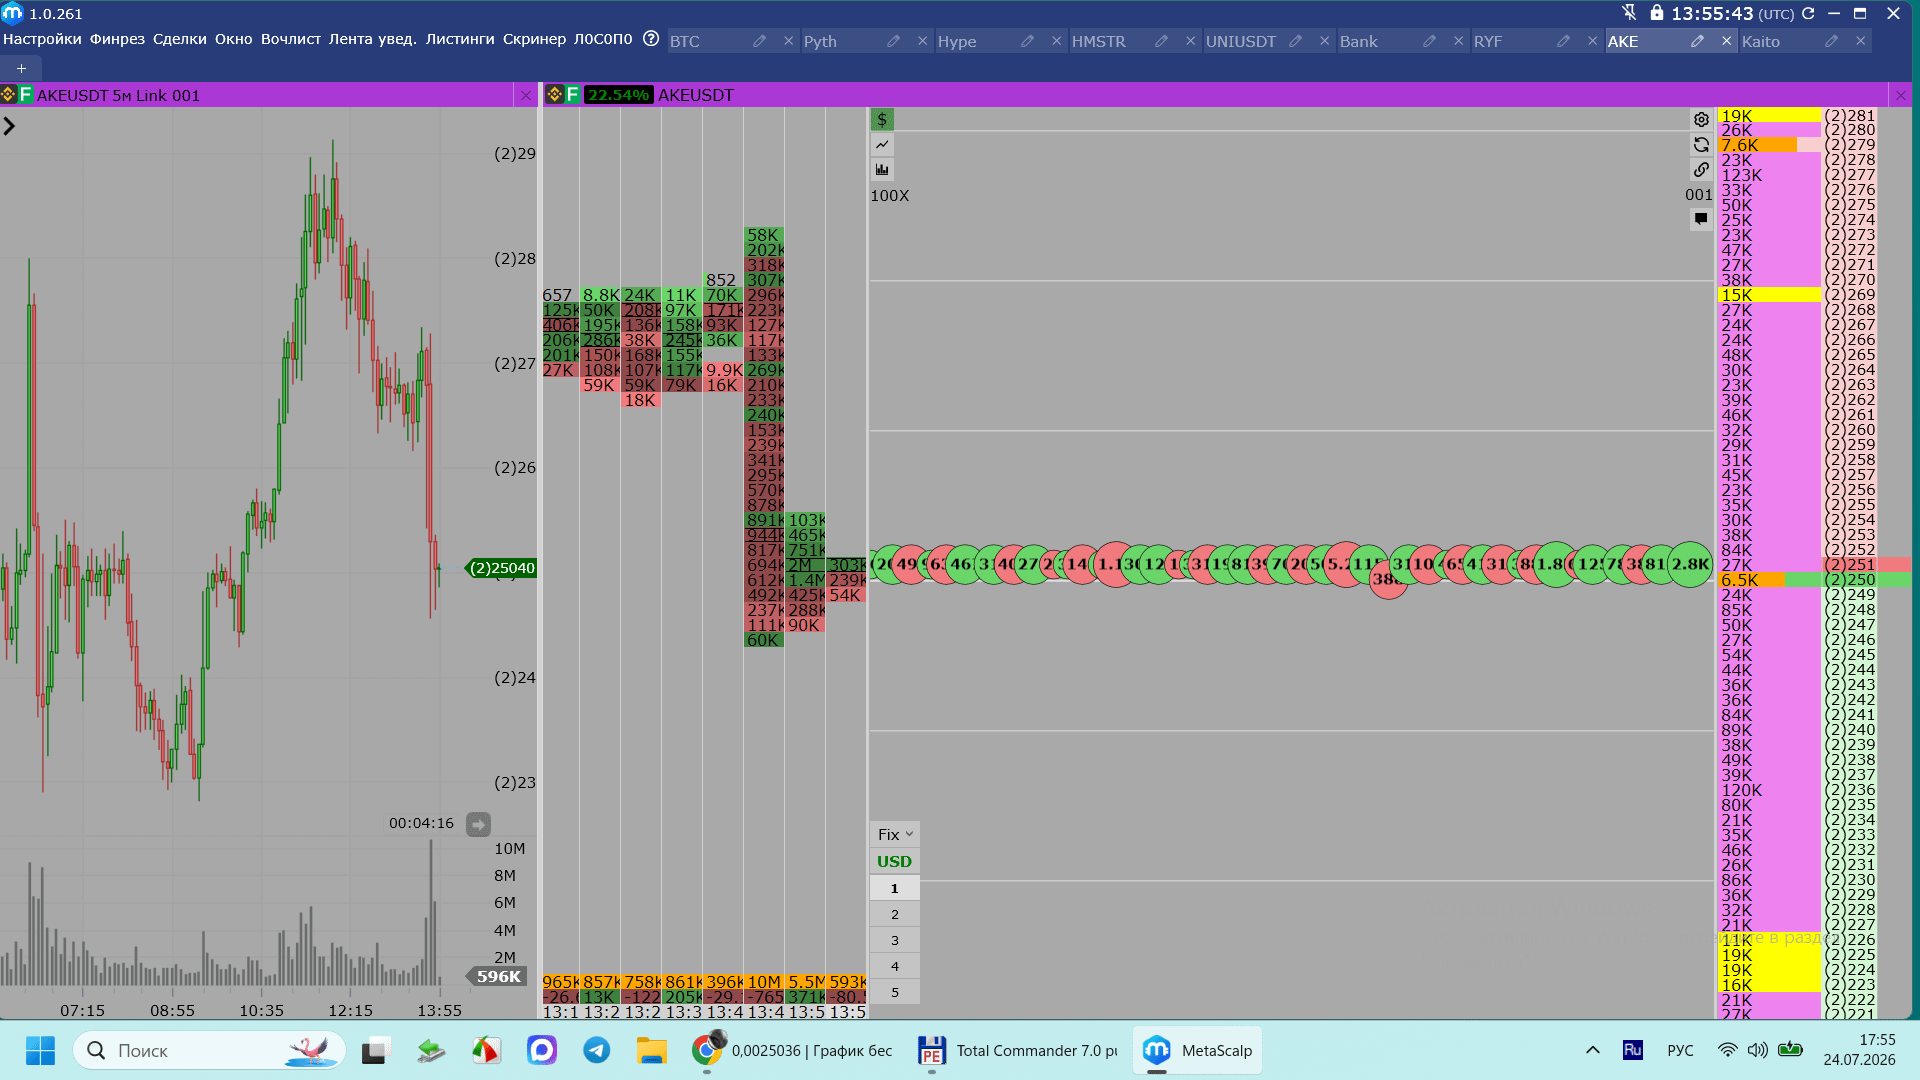
Many orders on both sides means the market is “tight”: at nearby levels there are both buyers and sellers. This often happens in zones where traders place stop-losses and take-profits, or where large players hold levels.
What this means for price: as long as there is no clear imbalance, the price may “chop” in place. A sudden move usually occurs when one side gets “pushed out” (for example, when stops trigger) and liquidity on one side disappears.
Remember this: orders in the order book can be canceled or moved at any moment. That’s why it’s better to look at the order book together with volume and price—then the picture becomes clearer.
Important nuances and risks
This is a futures market: leverage and liquidations are involved here. Sharp moves and volume spikes are a normal occurrence.
An asset with relatively low market capitalization: such tokens can move strongly and quickly even on moderate volumes.
Technical analysis does not guarantee future price movement: it only shows probabilities based on historical data.
Disclaimer: this is not an individual investment recommendation. Any trades on an exchange involve risk, and you may lose invested funds.