Here is a detailed breakdown and technical analysis of the $POPMARTUSDT Perpetual Futures chart provided in English:
📊 Image Overview
* Trading Pair: $POPMARTUSDT (Perpetual Futures)
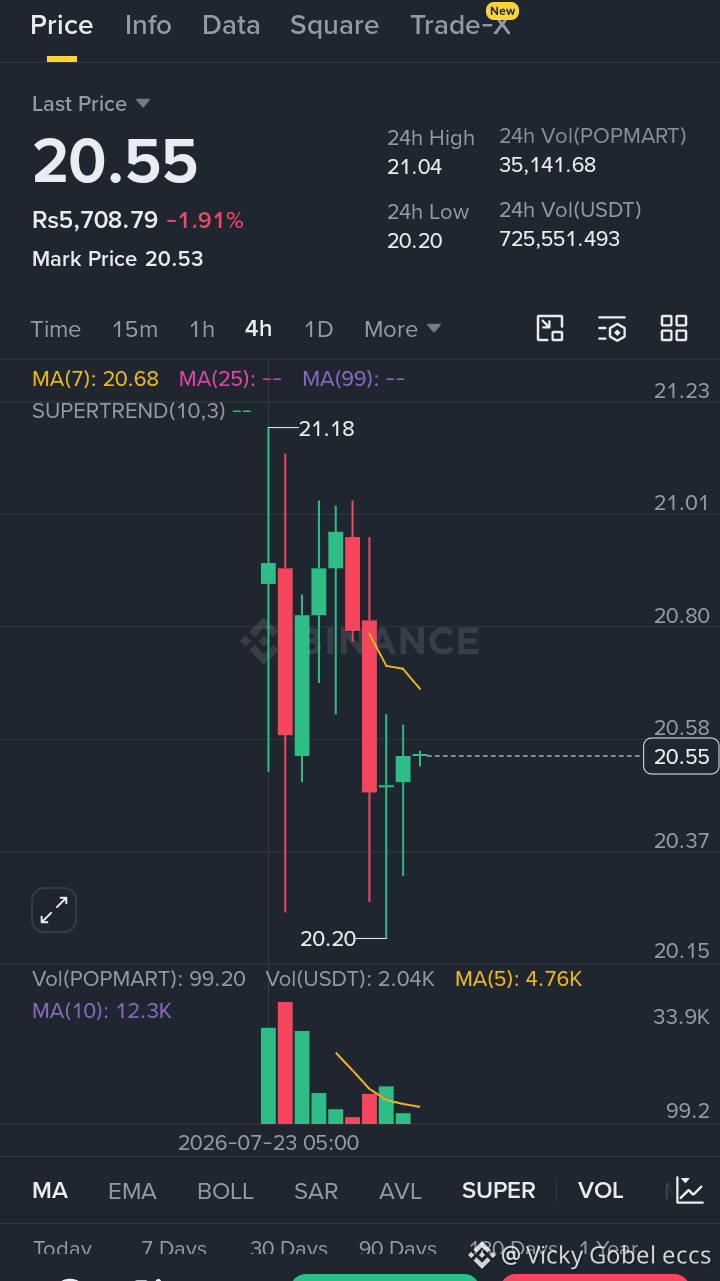
* Current Price: 20.55 $USDT (Down -1.91%)
* 24h High / Low: 21.04 / 20.20
* Timeframe: 4-Hour (4h)
* Market Status: Off-Hours (Indicates reduced trading activity or traditional market closure)
📈 Technical Breakdown
1. Key Price Levels
* Immediate Resistance: 20.68 - 21.18 USDT
* The Moving Average (MA 7) sits at 20.68, acting as immediate overhead resistance.
* The strong rejection from 21.18 marks a critical resistance zone for buyers to overcome.
* Key Support Level: 20.20 USDT
* Price dropped to 20.20 twice and showed a small bounce, making 20.20 the crucial short-term support level.
2. Indicators & Volume
* Trend Indicator: The price is trading below the short-term moving average (MA(7) = 20.68), signaling a short-term bearish / sideways bias.
* Volume: Volume spiked significantly during the strong red candles and has since tapered off, showing lower momentum during this slight bounce.
🔮 Possible Scenarios & Market Outlook
🔴 Bearish Scenario (If Support Breaks)
* If the price fails to hold above 20.20 $USDT, a breakdown below this support could trigger further downside momentum toward lower psychological levels (e.g., 20.00 $USDT or lower).
🟢 Bullish Scenario (If Resistance Reclaimed)
* To reverse the short-term downtrend, buyers need to push the price above 20.68 $USDT (MA 7) and clear 21.00 $USDT with strong volume. Reclaiming 21.18 $USDT would confirm a bullish continuation.
> ⚠️ Trading Risk Notice: The market is currently marked as Off-Hours, which can lead to lower liquidity, higher slippage, or sudden price gaps when regular trading volume resumes. Always use a strict Stop-Loss and manage your leverage responsibly.
>
#KRXActivatesSellSideSidecar
📊 Image Overview
* Trading Pair: $POPMARTUSDT (Perpetual Futures)
* Current Price: 20.55 $USDT (Down -1.91%)
* 24h High / Low: 21.04 / 20.20
* Timeframe: 4-Hour (4h)
* Market Status: Off-Hours (Indicates reduced trading activity or traditional market closure)
📈 Technical Breakdown
1. Key Price Levels
* Immediate Resistance: 20.68 - 21.18 USDT
* The Moving Average (MA 7) sits at 20.68, acting as immediate overhead resistance.
* The strong rejection from 21.18 marks a critical resistance zone for buyers to overcome.
* Key Support Level: 20.20 USDT
* Price dropped to 20.20 twice and showed a small bounce, making 20.20 the crucial short-term support level.
2. Indicators & Volume
* Trend Indicator: The price is trading below the short-term moving average (MA(7) = 20.68), signaling a short-term bearish / sideways bias.
* Volume: Volume spiked significantly during the strong red candles and has since tapered off, showing lower momentum during this slight bounce.
🔮 Possible Scenarios & Market Outlook
🔴 Bearish Scenario (If Support Breaks)
* If the price fails to hold above 20.20 $USDT, a breakdown below this support could trigger further downside momentum toward lower psychological levels (e.g., 20.00 $USDT or lower).
🟢 Bullish Scenario (If Resistance Reclaimed)
* To reverse the short-term downtrend, buyers need to push the price above 20.68 $USDT (MA 7) and clear 21.00 $USDT with strong volume. Reclaiming 21.18 $USDT would confirm a bullish continuation.
> ⚠️ Trading Risk Notice: The market is currently marked as Off-Hours, which can lead to lower liquidity, higher slippage, or sudden price gaps when regular trading volume resumes. Always use a strict Stop-Loss and manage your leverage responsibly.
>
#KRXActivatesSellSideSidecar