In the field of digital currencies, I've been struggling and advancing for over eleven years. For the first seven years, I was deeply entangled in difficulties, burdened with debts amounting to as much as eight million. But a turning point came in the following four years, when through relentless effort and sharp insight, I achieved a magnificent transformation from financial hardship to financial freedom. As a seasoned participant in the crypto circle, I've personally experienced countless market fluctuations. The astonishing traps and challenges have tested my wisdom and courage time and again.
During this journey, I once lost my way and endured the bitterness of failure; I also felt ecstatic with occasional victories, only to plunge into deep disappointment in an instant. My emotions were like surging waves, a mix of various feelings that were hard to express. But time flies, and all storms will eventually pass. Today's me can face the ever-changing crypto world with a calm and composed mindset, continuing to move forward steadily on this path full of uncertainty and possibilities.
This article will deeply analyze and reveal the fundamental reasons ordinary people miss out on trend profits, and teach you step-by-step how to build a profitable trading framework.
Here is my summary based on practical experience and a month of 100-fold returns:
1. In-depth deconstruction: Why do you always fall before the trend starts?
Many people blame their lack of profit on 'uncertainty', but those who understand trends are everywhere; however, very few can 'endure' and 'take profits'. The fundamental reason is that the core logic of trend trading conflicts naturally with ordinary people's survival instincts and cognitive biases.
1. The misalignment of survival structures: The 'time rights' taken away by the pressures of life.
The essence of trends is not about becoming rich overnight, but about 'staying in the correct direction for long enough'. This requires traders to possess the patience to endure and sufficient capital.
Unfortunately, most people's living structures are debt-driven. Mortgage, car loans, raising children, daily expenses - the pressure of these rigid expenditures means you cannot afford to let capital sit idle for long, nor can you bear short-term unrealized losses.
When the market is in a prolonged bottoming phase and the trend has not emerged, your patience has already been exhausted by life’s bills. You cannot accept capital 'not doubling in years', and you fear that drawdowns during fluctuations will affect your quality of life, ultimately forced to cut positions in the dark before dawn, becoming 'collateral damage of life’s forced stop-loss'.
In contrast, those who make big money are often in a state of low debt and high cash flow. They do not rely on trading to put food on the table and can accept that capital sits idle like a crocodile for a long time. This 'living in a relaxed state' is the ticket for entering trend trading. What is more frightening is that the anxiety of lacking funds will give rise to a 'gambler's mentality', leading you to abandon steadfastness and instead chase short-term fluctuations, ultimately falling into the deadly cycle of 'buying high and selling low'.
1. The shackles of cognitive levels: three misconceptions about trends.
Even if you are well-off, if your cognition is not clear, you still cannot grasp the trend.
Myth one: Mistaking the market's 'noise' for a 'symphony'. Trends are about long-term certainty, while volatility is merely short-term emotion. Many beginners stare at minute or hourly charts and get dazzled by the daily fluctuations: mistaking normal pullbacks in an uptrend as tops and panicking to exit early; mistaking dead cat bounces in a downtrend for reversals and rushing to catch the bottom, only to get trapped. The data is heartbreaking: 72% of retail investors who catch the bottom against the trend end up losing money; 68% who escape the top against the trend sell too early and miss the main uptrend.
Myth two: Taking oneself too seriously, deluding oneself into thinking they can conquer trends. Trends are a torrent formed by the combined forces of capital, emotion, and fundamentals, with great inertia; individual efforts are like a mantis trying to stop a chariot. Yet many fall into the trap of 'overconfidence', taking contrarian actions as a means to showcase skills, always aiming to 'precisely catch tops and bottoms'. The result is losing all capital in repeated face-slaps while refusing to admit: in the face of trends, your subjective judgment is worthless.
Myth three: Desiring stable profits like a 'salary' while refusing to take risks. The iron law of trend trading is to incur countless small, controllable losses in order to obtain those few decisive large profits. Profits do not come from the win rate of each trade but from the relentless pursuit of a very small number of significant market movements. Yet most people treat it like a job, unable to tolerate consecutive small losses, so they begin to frequently alter strategies and adjust parameters, ultimately exhausting their capital in a volatile market. When the real market comes, you are already out of ammunition.
3. Execution system's fracture: The 'last mile' of unity between knowledge and action.
Even if you understand the principles, without a steel-like execution system, it is still just theoretical talk. Most people's failures manifest in three aspects:
1. Unregulated naked trading: There are no quantifiable standards to define trends (like how moving averages are arranged or how high and low points are adjusted), entry and exit rely entirely on market feeling. When the market fluctuates, emotions heighten, making you hesitate to buy when you should, and reluctant to sell when you should.
2. Risk control naked trading: Many people lack 'awareness of red lines', daring to lose 10% or more of total capital on a single trade. Once encountering a black swan event or a trend reversal, they explode their accounts, completely losing the chance to recover.
3. Inability to adapt: The only constant in the market is change. When faced with sudden policy shifts or false breakouts, lacking a plan leads to being caught off guard or letting greed cloud judgment, resulting in disastrous trades.
2. Full process breakdown: manage trading with machine-like precision.
If you want to profit from trends, you need to establish a set of precise workflows covering 'preparation - entry - holding - exit - review'. Perfect each link, and profits will naturally follow.
(1) Preparation before trading: Do not engage in unprepared battles.
Core principle: Clarify boundaries, and only trade in your market.
1. Eating according to the weather (identifying the environment): Trend strategies are not a universal key. Use the VIX (Volatility Index) as a directional indicator: When VIX is between 15-30, and volume increases moderately while leading assets are rising, it is the golden period for trends, trade boldly; when VIX is below 15, and volume shrinks while defensive sectors (banks, utilities) are strengthening, it is garbage time (consolidation period), where you can easily get slapped in the face, so control your actions; when VIX is above 30, the market is in a collapse mode, with extreme volatility, it is advisable to watch from the sidelines.
2. Choose the right track (selecting targets): Since we are trading trends, choose the strongest. For fundamentals, select industries with high prosperity, and for technicals, choose stocks with bullish moving averages and perfect volume-price combinations. Only trade 3-5 core targets and thoroughly understand their behavior.
3. Develop a battle plan (trading plan): Each trade must have a 'five-element checklist': direction, entry point, stop-loss level, take-profit level, and position size. Entry should occur when there is stability after a pullback or confirmation of a breakout; stop-loss should be placed at key points where the trend structure is broken (individual losses strictly controlled at 1%-2% of total capital); position size should be back-calculated based on stop-loss distance to ensure risks are never out of control.
4. Manage expectations: Acknowledge that 'losses are the cost of trading'. Do not pursue just making money; instead, aim for a net profit amidst many trades over a 100-trade cycle.
2. Entry decision-making: Accurately targeting the trend's starting point.
Core principle: Make bold hypotheses, validate cautiously, and enter positions gradually.
1. Signal verification: Don't be fooled by a single indicator. Use a 'combination punch' for validation: technical indicators (moving average crossovers, ADX > 25), volume (must increase by 30% or more during breakouts), K-line patterns (large bullish candles, no long upper shadows) must resonate to be effective signals.
2. Trial and error and increasing positions: No one can be precise at the beginning; start with a small position of 5% to experiment. If the trend meets expectations, breaks and pulls back without breaking, and strengthens, then pyramid-style increase the position, keeping the total position at 20%-30%. This is called 'not letting go until you see the rabbit'.
3. Identify false breakouts: If you encounter these three situations, run quickly: one is that prices reach new highs but volumes shrink (volume-price divergence); the second is that after a breakout, the next day, the price falls back (false breakout); the third is that during the consolidation phase, there is a volume breakout. These are all traps.
(3) Position management: Protecting profits is more challenging than seizing opportunities.
Core principle: Follow the rules; do not let your heart command your brain.
1. Trend tracking: Use tools to monitor trends. As long as the stock price is above the 5-day moving average or the ADX indicator remains strong, hold firmly. Once the indicators deteriorate, be alert.
2. Move stop loss (lock in profits): As the price rises, move the stop-loss level up. After a 10% gain, adjust to breakeven; after a 20% gain, lock in 10% of profits. Let profits run but never let gains turn into losses.
3. Dynamic position adjustment: In favorable conditions, watch for signals of strengthening trends (secondary breakouts) to moderately increase positions (do not exceed the base position); in adverse conditions, once signs of fatigue appear (volume-price divergence), immediately reduce positions to preserve capital. Set a 'circuit breaker mechanism' for yourself; if losses reach a limit, shut down immediately.
4. Emergency plan: Think ahead about worst-case scenarios. Negative policies? Internet outages? Poor performance? As long as survival limits are triggered, clear positions unconditionally; preserving capital is paramount.
4. Exit execution: Secure profits, refuse roller coasters.
Core principle: Selling must be decisive, not greedy, and not fantasizing.
1. Take profit strategy: Combine 'partial take profit' and 'trend reversal'. When the market is in a good phase, and the price reaches a target increase (like 15%, 30%), gradually reduce positions to take money off the table; when the market reverses (breaking long-term trend lines, significant bearish volume), regardless of whether you have made enough profit, clear all positions at once.
2. Ironclad stop loss: The stop loss line is a high-pressure line; touching it means you must exit. Do not hold onto false hopes or wait for a rebound. The stop loss is not admitting defeat but preserving the chips for the next round.
3. Take a proactive stance: If something feels off (after 3-5 consecutive losses) or the market enters garbage time, actively exit and take a break. Going flat is also a position to keep you clear-headed and prevent wasting resources in chaos.
(5) Post-trade review: Allow your system to evolve.
Core principle: Do not waste every loss.
1. Keep records: Each trade must be documented; note what you were thinking at the time, why you bought, and why you sold. This is your most valuable asset.
2. In-depth analysis: Is profit due to luck or skill? Is loss due to system loopholes or carelessness? If the win rate is below 40% or the risk-reward ratio is unprofitable, the system must be repaired; if the drawdown is too large, the position size must be reduced.
3. Iterative upgrades: The market changes, and the system must also be adjusted slightly. But do not mess with the core logic; all optimizations must undergo historical backtesting and live validation to prevent deterioration.
Three, trend trading is the ultimate management of human nature.
90% of people do not make money, not because they are stupid, but because their lives are too tight, their cognition is too short-sighted, and their execution is too casual.
Trends never miss; what is missing are those who can 'sit through the cold bench'. Those who are not burdened by debts, have patience, and obey discipline are the true hunters.
The core of full-process management is to use cold rules to suppress hot emotions. From the restraint in filtering opportunities, the agony of waiting in a position, to the decisiveness in cutting losses, each link is a refinement of human nature.
True growth is not about being able to predict the market, but about learning to manage yourself.
Put down the arrogance of 'defeating the market', learn to respect and adapt, and use systems to manage yourself.
Remember: The money in trends is a reward for those who 'live comfortably enough' and 'work meticulously enough'.
This is a long journey of cultivation; may we both persist until the end.
Next, I will share a technique! I will clarify the Bollinger Bands indicator for you - this thing is absolutely a 'jack of all trades' in the trading world; it can catch breakout markets, reverse tops and bottoms, and also handle trend pullbacks. Many people use the Bollinger Bands just for a rough understanding; today I will reveal the most core applications, and once you learn it, you will be able to accurately find entry points and unleash the full power of this indicator.
First, understand: the underlying logic of the Bollinger Bands.
Understanding 'volatility' is crucial to using the Bollinger Bands.
To effectively use the Bollinger Bands, the first step is not to memorize parameters but to understand price volatility - this is the core essence of the Bollinger Bands.
Price fluctuations can be divided into two types: low volatility and high volatility, corresponding to completely different market conditions.
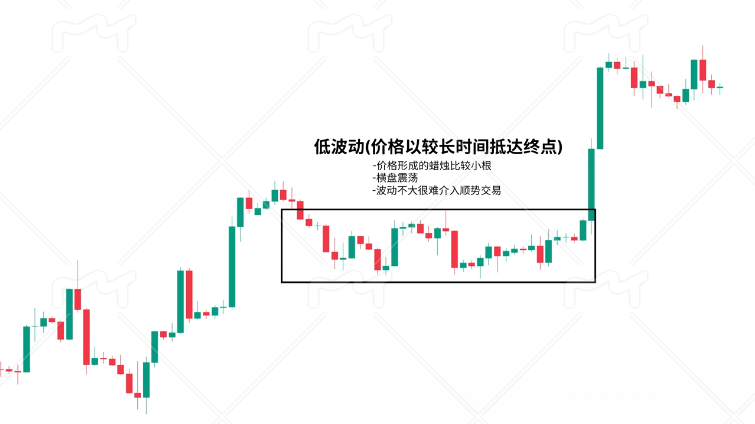
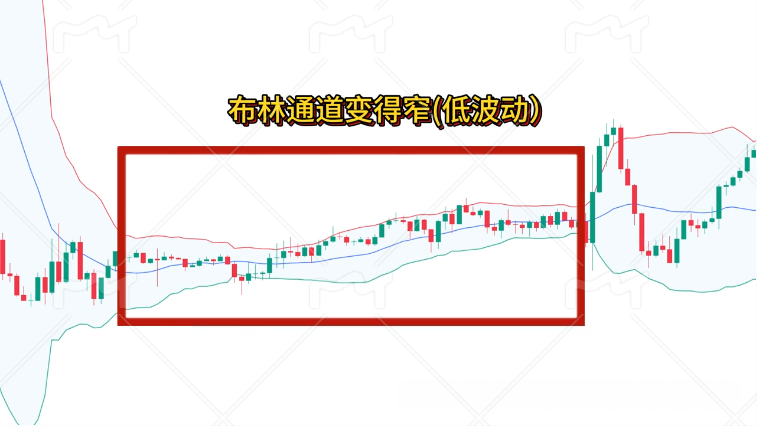
1. Low volatility = range oscillation.
During low volatility, prices move sluggishly, taking a long time to shift even a little distance, with K-lines being mostly small bearish and bullish candles. In this kind of market, prices oscillate back and forth within a range, lacking any clear direction.
In such a market, do not force trend trades, as you will likely get stopped out repeatedly. To make money, trade within ranges; buying high and selling low is the way.
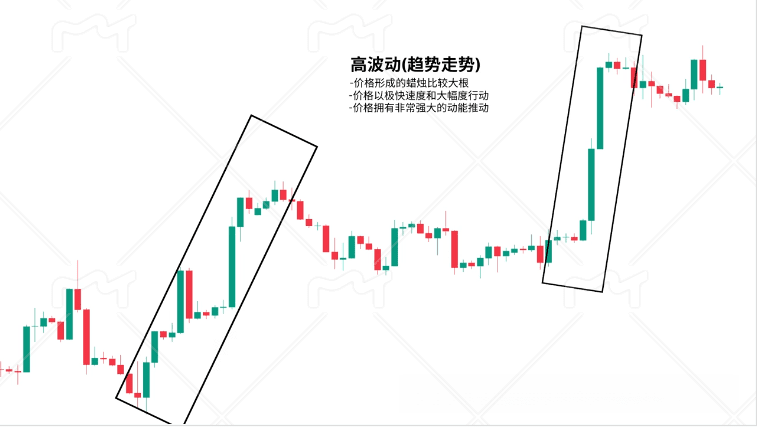
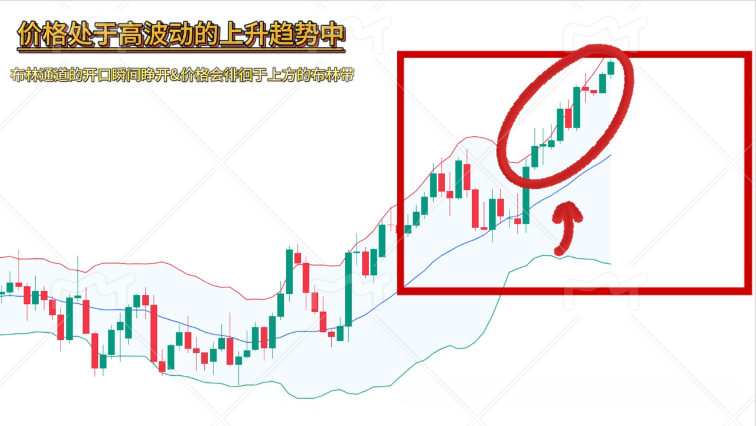
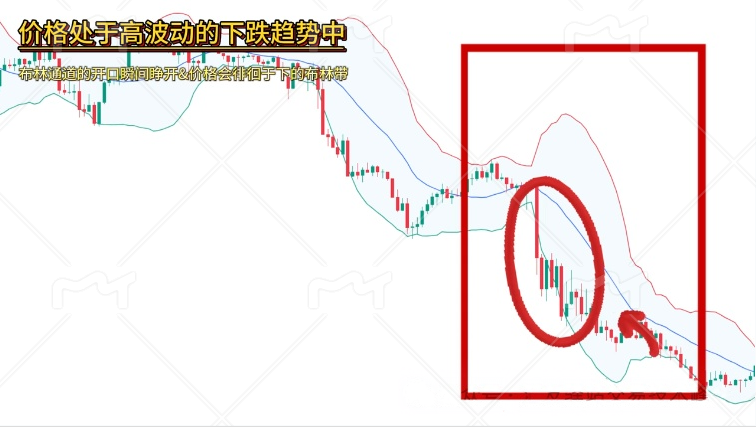
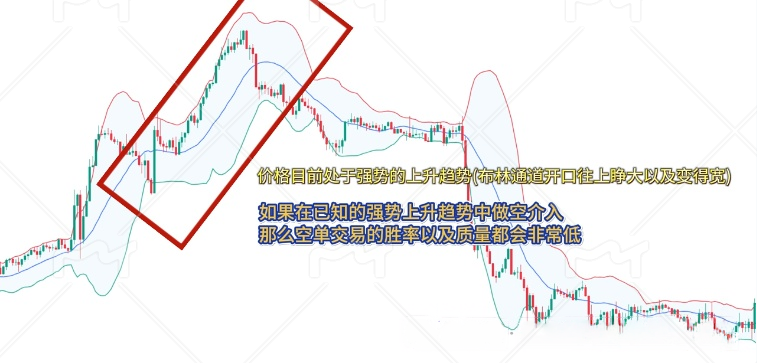
2. High volatility = trend market.
During high volatility, the price behaves like it has been injected with energy, either skyrocketing or plummeting, with K-lines being mostly large bullish and bearish candles. A single market movement can create massive space. In this kind of market, the trend is extremely strong; following the direction to trade will result in profits even with closed eyes.
The question arises: How do you quickly determine whether the current market is low volatility or high volatility?
The answer is the Bollinger Bands - it is specifically designed to quantify volatility.
The basic composition of the Bollinger Bands: three lines, don't complicate it.
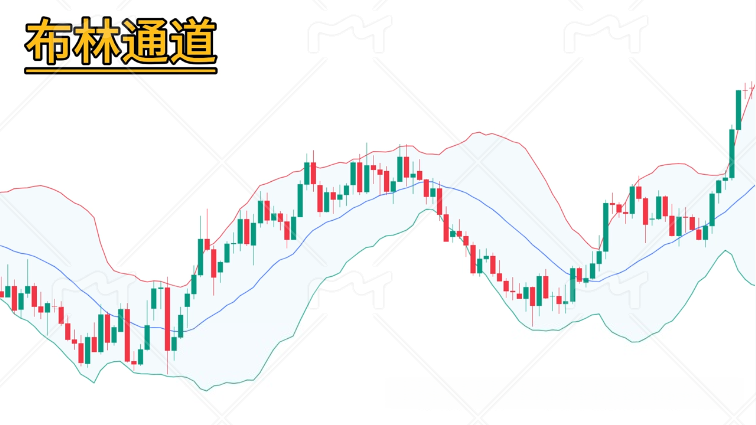
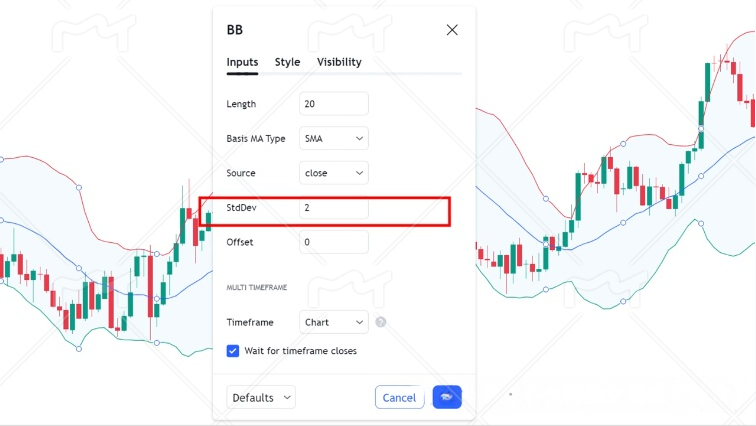
The Bollinger Bands consist of three lines; use the default parameters directly without arbitrary modifications: period 20, standard deviation 2.
The middle line: is the ordinary 20-day moving average, representing the average price trend;
The upper line: 20-day moving average + 2 times the standard deviation, which is the price resistance level;
The lower line: 20-day moving average - 2 times the standard deviation, which is the price support level.
With three lines combined, the magnitude of price fluctuations becomes clear:
Low volatility (range): The Bollinger Bands will narrow significantly, with the three lines squeezing together, and the price will oscillate between the upper and lower bands;
High volatility (trend): The Bollinger Bands will suddenly 'open up' and become particularly wide.
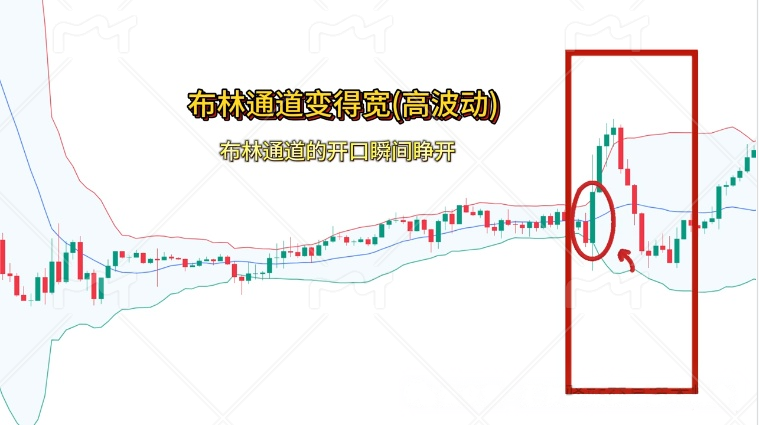
Prices will closely follow the upper band (uptrend) or lower band (downtrend), and may occasionally move outside the bands.
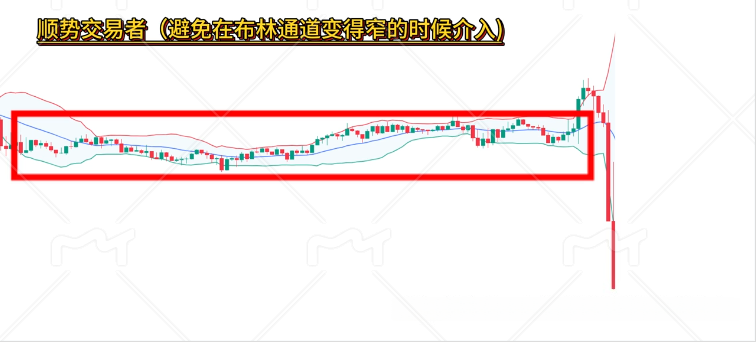
Key mantra: Do not trade trends in a narrow mouth; do not trade reversals in a wide mouth.
This is my core insight into using the Bollinger Bands; remember it well:
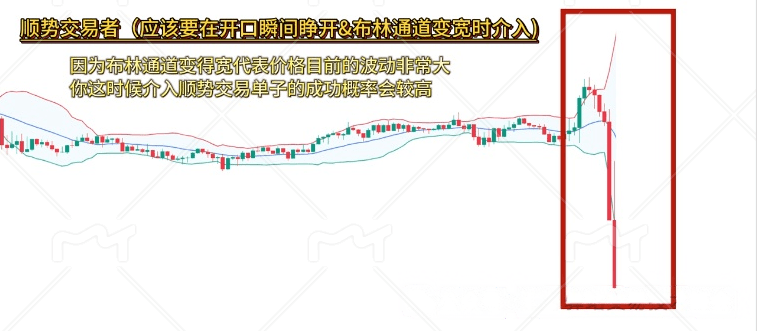
If you are a trend trader: Do not enter when the Bollinger Bands are narrow! A narrow mouth represents a range, and the trend is weak; forcing a trend trade in such conditions is like giving away money. Wait for the Bollinger Bands to open, and when the price is moving along the track, enter then, and your win rate will double.
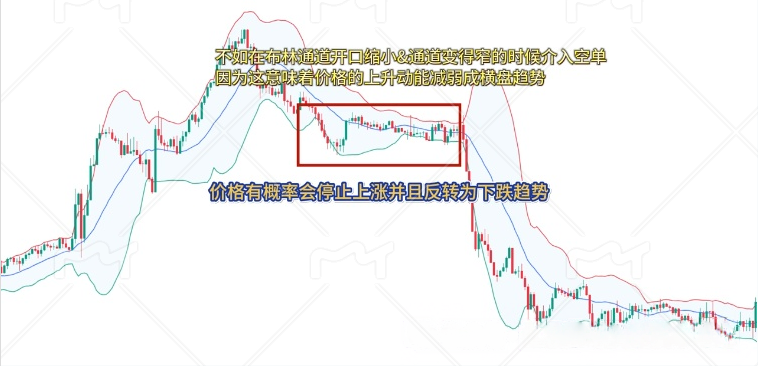
If you want to conduct reversal trades: do not enter when the Bollinger Bands are wide! A wide mouth indicates a strong trend, and trading against that trend is suicidal. Wait for the Bollinger Bands to narrow, indicating a weakening trend momentum, then combine with other signals to find reversal opportunities.
Three core strategies:
Use the Bollinger Bands to navigate all market conditions.
Once you understand the relationship between volatility and Bollinger Bands, the next step is practical application - three strategies covering breakout, reversal, and pullback markets that can be directly applied.
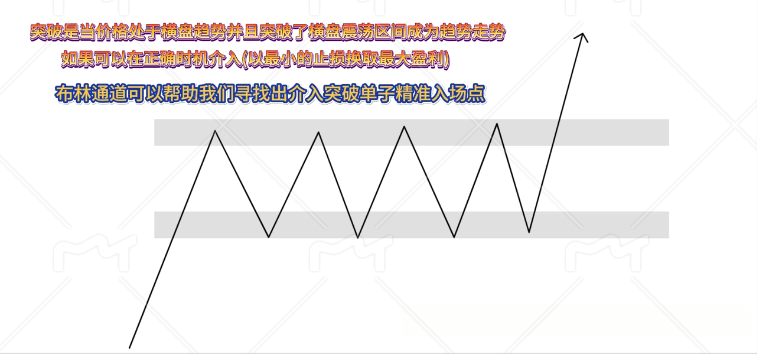
Strategy one: Breakout strategy - capture the 'explosion point' from range to trend.
Breakouts are one of the most cost-effective trading opportunities: small stop losses, large profit potential. The Bollinger Bands are the 'magic tool' for finding breakouts.
Operation steps:
Find the narrow mouth: First check if the Bollinger Bands have narrowed, whether the price is oscillating within a range, and draw the support and resistance levels of the range;
Wait for a breakout: Patiently wait for the price to break through with a solid K-line - for long positions, wait for a bullish candle to break the resistance level + the upper Bollinger band.
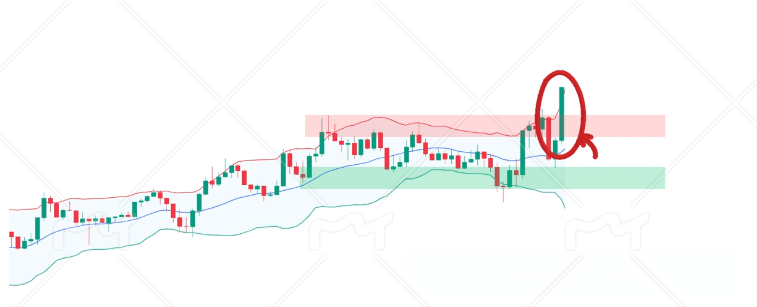
Short selling waits for the bearish candle to break the support level + the lower Bollinger band;
Timing the entry: Enter after the breakout K-line has fully formed; do not guess in advance!
Core logic:
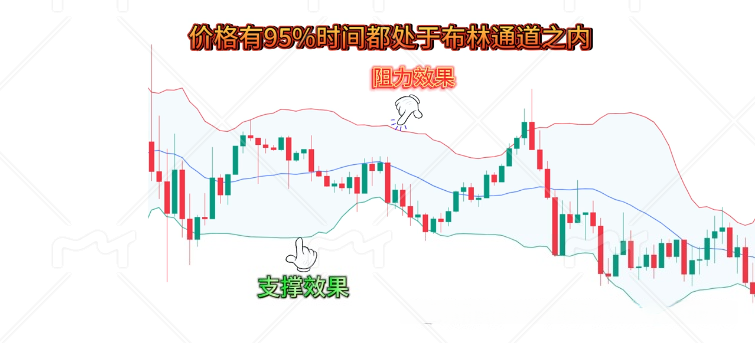
Prices spend 95% of their time moving within the Bollinger Bands; once they break the bands, it indicates strong trend momentum, and the balance of the range has been broken, signaling the arrival of a new trend. The probability of success for such breakouts is very high, and the stop loss can be set just below/above the breakout point, which is very tight.
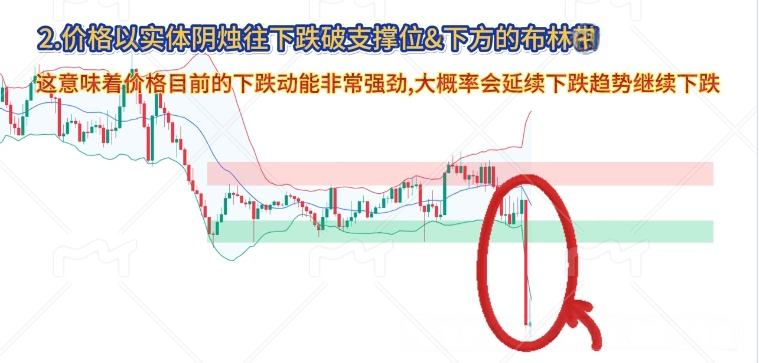
For example: In a downtrend, the price is oscillating in a range, and the Bollinger Bands are narrowing.
When the price uses a large bearish candle to break the support level + the lower Bollinger band, immediately enter short; a smooth downward trend is likely to follow.
Strategy two: Reversal strategy - catching bottoms and tops, seizing the 'turning points' of trends.
The upper and lower bands of the Bollinger Bands themselves are very strong support and resistance levels; using them for reversals has high precision.
Operation steps:
Look at the position: When the price is in a range, touching the upper Bollinger band is resistance, while touching the lower band is support;
Wait for signals: Don't enter just because you see the track! Make sure to wait for confirmation of reversal K-line patterns -
When touching the upper band, go short: wait for bearish engulfing patterns, shooting stars, and similar shapes to appear;
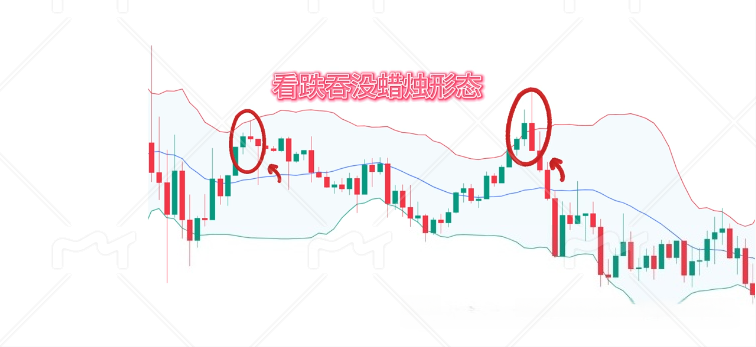
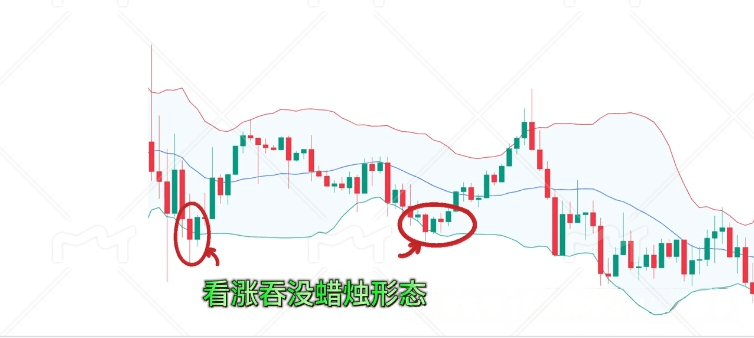
When touching the lower band, go long: wait for bullish engulfing patterns, hammer candlesticks, and similar shapes to appear;
Auxiliary confirmation: It is best to also incorporate support and resistance levels and the RSI indicator (like overbought and oversold) for a higher win rate.
Core logic:
The upper and lower bands of the Bollinger Bands represent the 'extreme positions' of prices; when prices reach here, it's like a spring being compressed to its limit, and they are likely to rebound. However, you must wait for reversal signals; otherwise, you might encounter 'false support/false resistance' and be pushed along by the trend.
Strategy three: Pullback strategy - go with the trend, seize the 'entry point' within the trend.
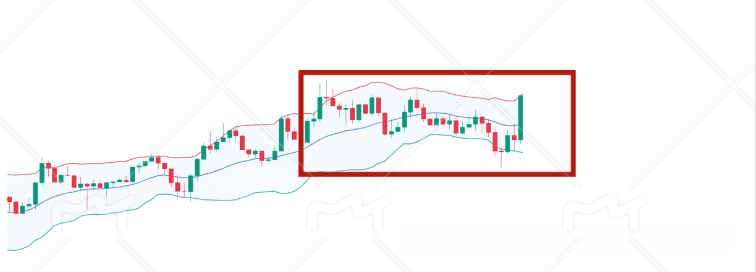
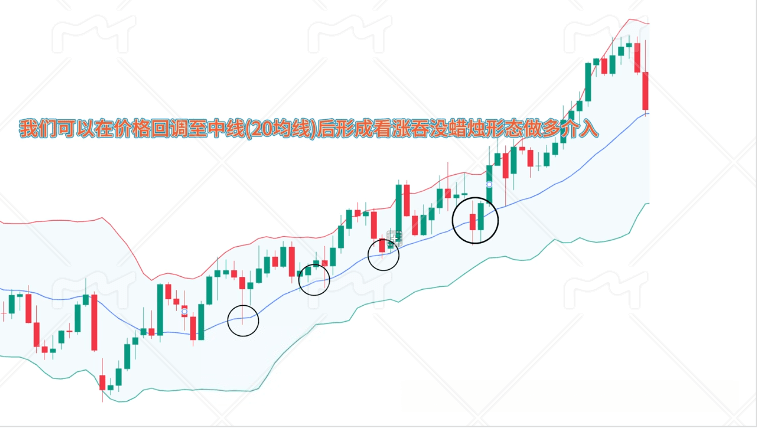
In trending markets, prices will not continuously rise/fall but will always pull back. The middle line of the Bollinger Bands (20-day moving average) is the best 'pullback target' and also the best position for increasing positions in line with the trend.
Operation steps:
Define the trend: First look at the big trend - if the price is touching the upper Bollinger band, it is an uptrend; if it is touching the lower band, it is a downtrend;
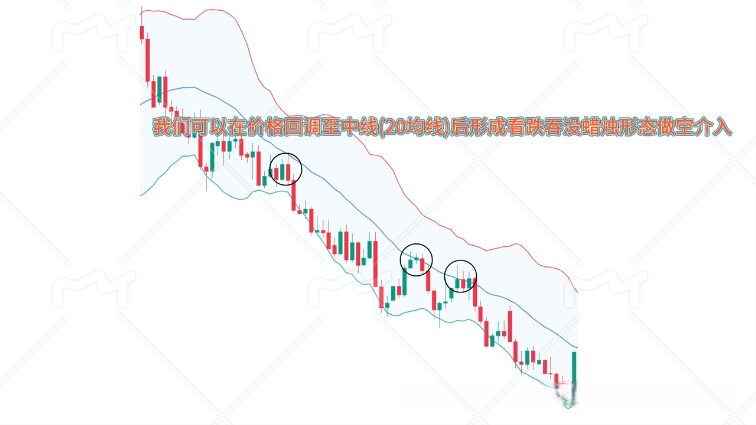
Wait for pullbacks: In an uptrend, wait for prices to pull back to the middle Bollinger band (20-day moving average); in a downtrend, wait for prices to rebound to the middle Bollinger band (20-day moving average);
Find the entry point: After the price pulls back to the middle line, wait for a bullish K-line shape to appear -
Uptrend: wait for bullish engulfing patterns or hammer candlesticks to enter long;
In a downtrend: wait for bearish engulfing patterns, shooting stars, and then enter short.
Core logic:
The middle line of the Bollinger Bands in trending markets is the strongest support/resistance level. In an uptrend, the middle line is the 'lifeline' of bulls, and a pullback to this level is likely to rebound; in a downtrend, the middle line is the 'lifeline' of bears, and a rebound to this level is likely to continue falling.
Final summary: The core of the Bollinger Bands.
'Combining' is greater than 'using alone'.
The Bollinger Bands are a good tool, but they are not a 'holy grail'. Trading solely based on Bollinger Bands will not yield a high win rate.
To maximize its effectiveness, remember: Bollinger Bands + trend structure + K-line shape + key price levels, multiple signals resonating together are the core of high win rate trading.
For example, when using the breakout strategy, confirm the direction with trend structures; when using the reversal strategy, confirm with RSI overbought/oversold; when using the pullback strategy, confirm with support and resistance levels.
Remember: Indicators are meant to assist us in judging the market, not to replace our thinking. Once you completely understand the volatility logic of the Bollinger Bands and combine it with other technical analyses, you can swim effortlessly in trading and easily catch significant market movements.
The above is the trading experience shared by Yan An today. Many times, you lose many opportunities to make money due to your doubts; if you do not dare to boldly try, engage, and understand, how will you know the pros and cons? You can only know how to proceed with the next step after taking the first step. A cup of warm tea, a suggestion; I am both a teacher and a friend who can talk.
Meeting is fate, and knowing each other is destiny. I firmly believe that those who are destined will eventually meet, and those who part ways are destined by heaven. The road of investment is long; temporary gains and losses are just the tip of the iceberg along the way. One must understand that even the wisest will have their moments of folly, and the foolish may have their moments of luck. Regardless of emotions, time will not pause for you. Pick up your frustrations and stand up to move forward anew.
The secret skills have been given to you; whether you can make a name for yourself in the world depends on your own efforts.
Everyone must save these methods. If you find them useful, feel free to share them with more people trading cryptocurrencies around you. Follow me for more valuable content from the crypto world. After being rained on, I am willing to hold an umbrella for the retail investors! Follow me, and we will walk together on the road of cryptocurrency!