.
First: The Daily Framework (1D)
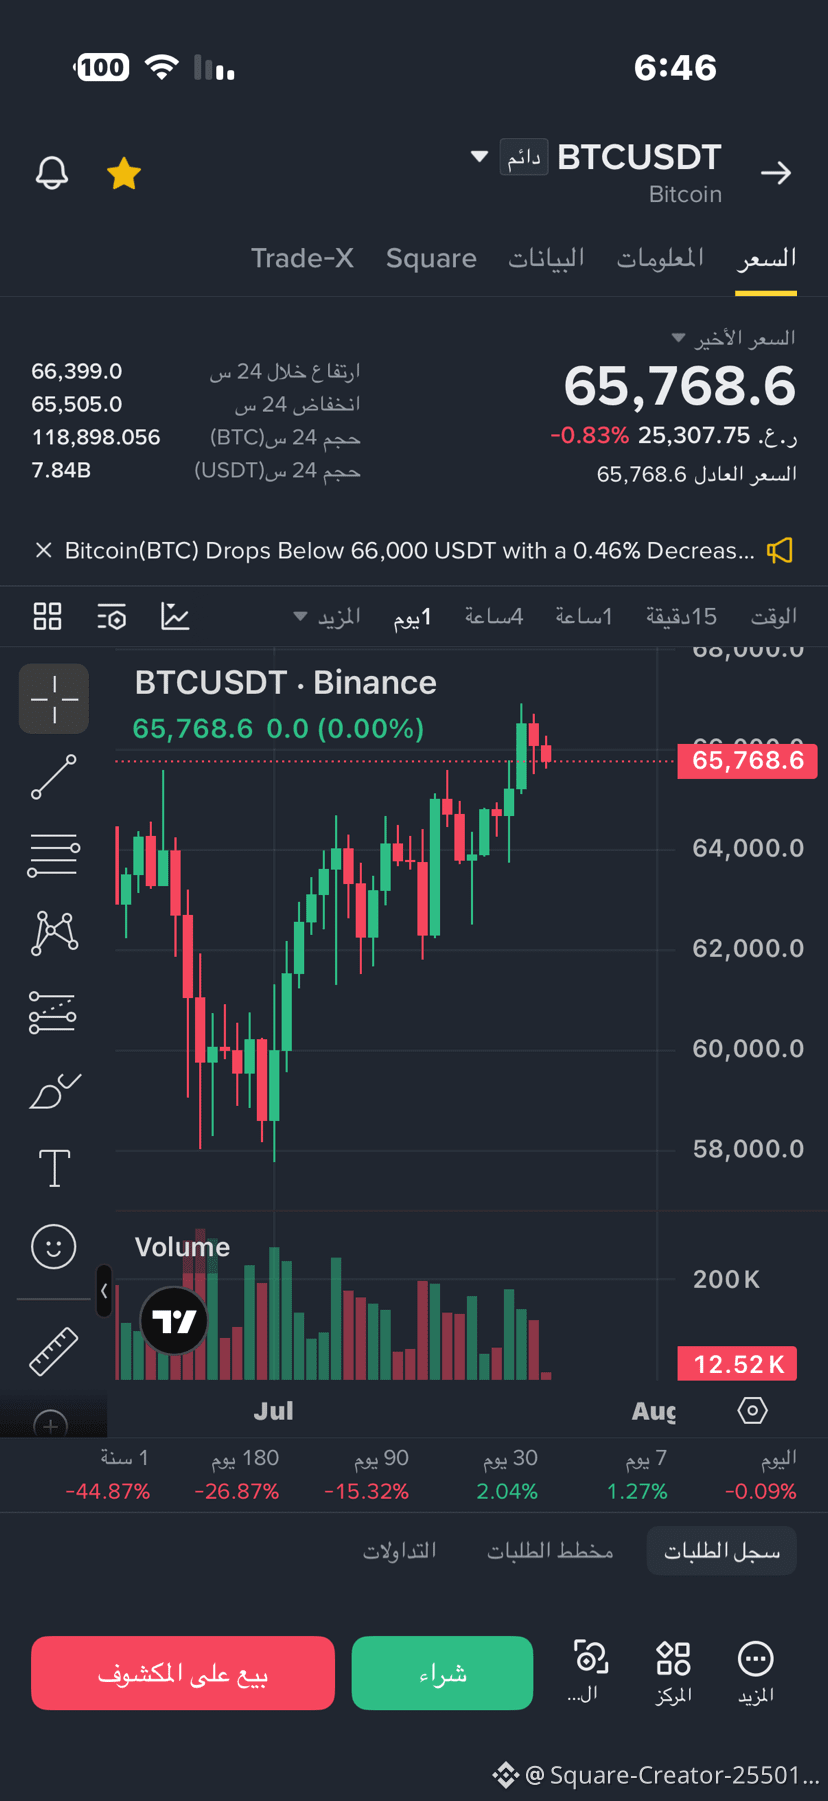
From the first image:
* The overall trend is still bearish because the previous major highs have not been broken yet.
* But since the 58K bottom, the price has formed higher highs and higher lows.
* Therefore, the situation is:
A rally within a generally bearish trend.
This is the same concept we learned earlier.
Second: The 4-Hour Framework (4H)
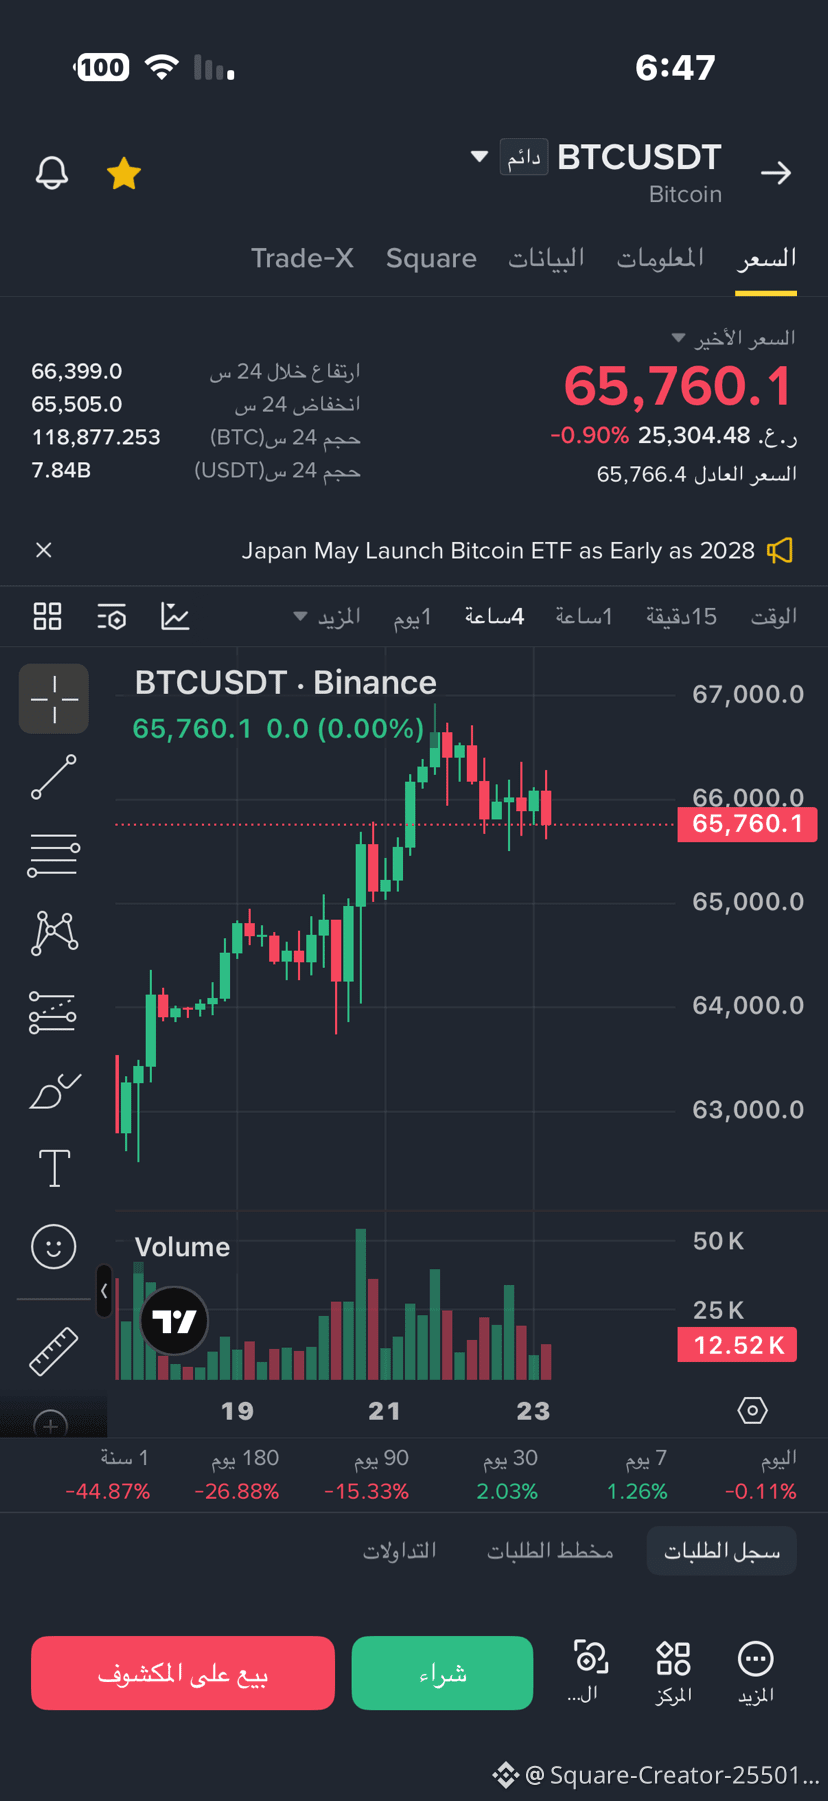
The second image shows that:
* The price rose strongly to the area of approximately 66,300 - 66,400.
* After that, it started moving sideways with small candles.
* There is no aggressive selling, only consolidation/relief after the rally.
This means buyers have not given up yet, but they also couldn’t break through the resistance.
Third: The 15-Minute Framework
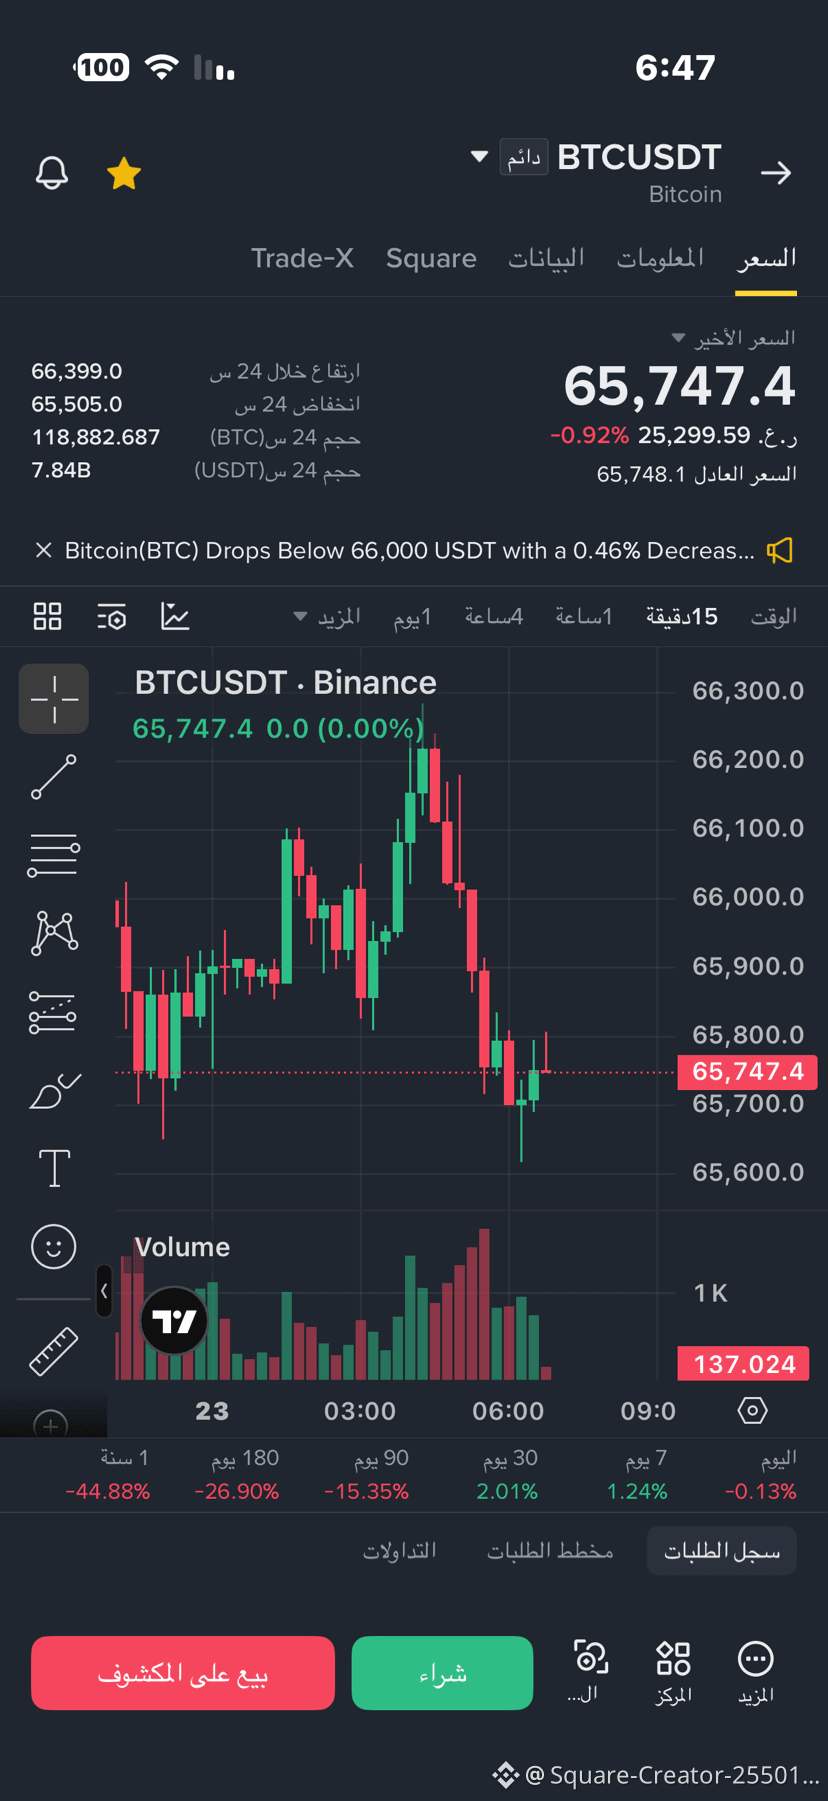
The third image shows:
* A drop from around 66,200 to 65,700.
* Then candles with lower wicks appeared around 65,700.
* Buyers began defending this area.
So, in the short term, there is an attempt to stabilize.
Reading the market story
The story told by the candles is:
1. Buyers pushed the price from 58K to 66K.
2. When the price reached resistance, sellers started taking profits.
3. The current drop so far looks like a correction, not a complete reversal.
4. There has not been a strong support break yet.
Key Levels
Resistance
* 66,300 - 66,400
* then 66,900 - 67,000
If it closes above them with a successful retest, the chances of continued upward movement will increase.
Support
* 65,700 (current support)
* then 65,200
* then 64,500
If 65,700 is broken with a clear close, the correction may extend to 65,200 or 64,500.
First: The Daily Framework (1D)
From the first image:
* The overall trend is still bearish because the previous major highs have not been broken yet.
* But since the 58K bottom, the price has formed higher highs and higher lows.
* Therefore, the situation is:
A rally within a generally bearish trend.
This is the same concept we learned earlier.
Second: The 4-Hour Framework (4H)
The second image shows that:
* The price rose strongly to the area of approximately 66,300 - 66,400.
* After that, it started moving sideways with small candles.
* There is no aggressive selling, only consolidation/relief after the rally.
This means buyers have not given up yet, but they also couldn’t break through the resistance.
Third: The 15-Minute Framework
The third image shows:
* A drop from around 66,200 to 65,700.
* Then candles with lower wicks appeared around 65,700.
* Buyers began defending this area.
So, in the short term, there is an attempt to stabilize.
Reading the market story
The story told by the candles is:
1. Buyers pushed the price from 58K to 66K.
2. When the price reached resistance, sellers started taking profits.
3. The current drop so far looks like a correction, not a complete reversal.
4. There has not been a strong support break yet.
Key Levels
Resistance
* 66,300 - 66,400
* then 66,900 - 67,000
If it closes above them with a successful retest, the chances of continued upward movement will increase.
Support
* 65,700 (current support)
* then 65,200
* then 64,500
If 65,700 is broken with a clear close, the correction may extend to 65,200 or 64,500.