

Brothers in the plaza, welcome to the fourth lesson of the现货交易实战 series!
In the previous lesson, we fixed the 'internal cultivation' (trading mindset). Starting today, we'll begin practicing 'techniques' and 'weapons'.
I'd like to ask you a question: What software do you use for chart watching and analysis?
If your answer is: 'I just use the built-in K-line chart from the exchange.' Then I regret to tell you, you might be at a significant 'information disadvantage'.
It's like going into battle—the opposing professional sniper is using a high-precision rifle equipped with thermal imaging and range-finding devices, while you're holding a crude hunting rifle with only a simple sight. Although both can shoot, in complex battlefield conditions, your survival rate is drastically different.
Many novices lose money not because they are foolish, but because they are 'blind.' They cannot see the overall picture, the data, or the opponent's layout.
Today, I want to take you out of the narrow window of the exchange and see what kind of nuclear-grade tools are installed in the 'cockpit' of professional traders.
Re-examine your battlefield: Exchanges are not just for 'buying and selling.'
In the (Beginner's Survival Course), we teach you how to choose safe exchanges. However, in practice, as traders, we need to look at more hardcore indicators.
Have you ever encountered this situation: you clearly see the price is 100, you click buy, but the transaction price is actually 100.5? Or you want to sell but find only a few people are taking the offer, and as soon as you sell, the price drops?
This involves two professional concepts, which are the core criteria for evaluating whether an exchange is 'good to use':
Depth:
Imagine you are buying apples at a market. Stall A has 1000 pounds of apples, while Stall B only has 5 pounds. You are a big buyer and want to purchase 500 pounds. At Stall A, you can buy all of them at the original price; at Stall B, you can only buy 5 pounds, and then you have to raise the price to buy from another stall.
The better the depth of an exchange, the stronger its ability to accommodate large funds, and the harder it is to manipulate prices.Spread:
This refers to the difference between the 'buy price' and the 'sell price.'Exchange A: Buy 100.00, Sell 100.01 (very small spread, low trading cost).
Exchange B: Buy 100.00, Sell 100.50 (huge spread, losing 0.5% on every buy and sell).
As traders, we must choose a 'battlefield' with good depth and small spreads, which can save you huge hidden costs.
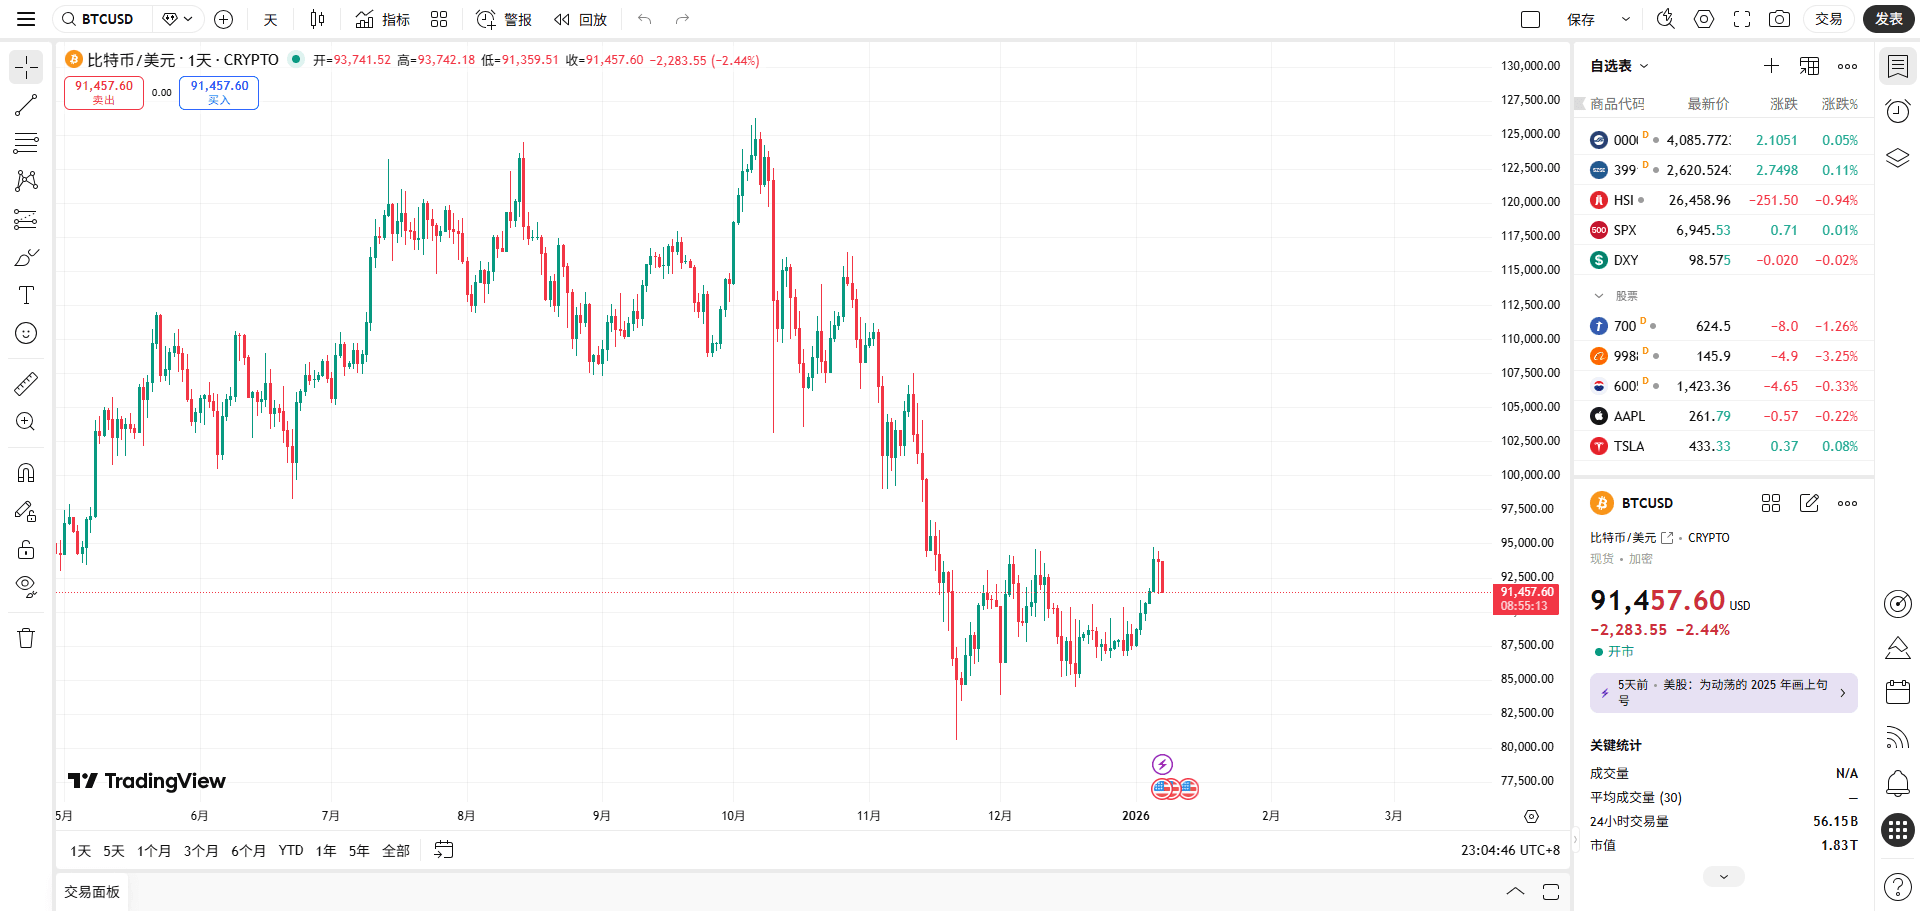
Tool 1: TradingView — your 'satellite map' 🗺️
If you are still using the exchange's crude candlestick interface to draw charts, please stop immediately.
TradingView (abbreviated as TV) is the charting software used by almost all professional traders worldwide. If the exchange's chart is a hand-drawn map, then TV is a real-time high-definition satellite map.
Why use it?
God's view: It can see the prices of all exchanges like Binance, OKX, Coinbase, etc., at the same time. Sometimes, a small exchange may spike while mainstream exchanges do not. If you only look at one, you can easily be misled.
Drawing memory: The support and resistance lines you draw and the notes you write will be permanently saved and synchronized in real-time on your mobile and computer. You don't need to redraw them every time you open it.
An extremely powerful indicator library: In addition to the basic MACD, it has thousands of custom indicators written by developers worldwide. Want to see Bitcoin's 'rainbow chart'? Want to see the 'Long/Short energy wave'? It's all here.
Task: Register for a TradingView account (the free version is sufficient), and add the cryptocurrencies you want to your watchlist. This is your first step towards professionalism.
Tool 2: CoinGlass — your 'thermal imaging radar' 📡
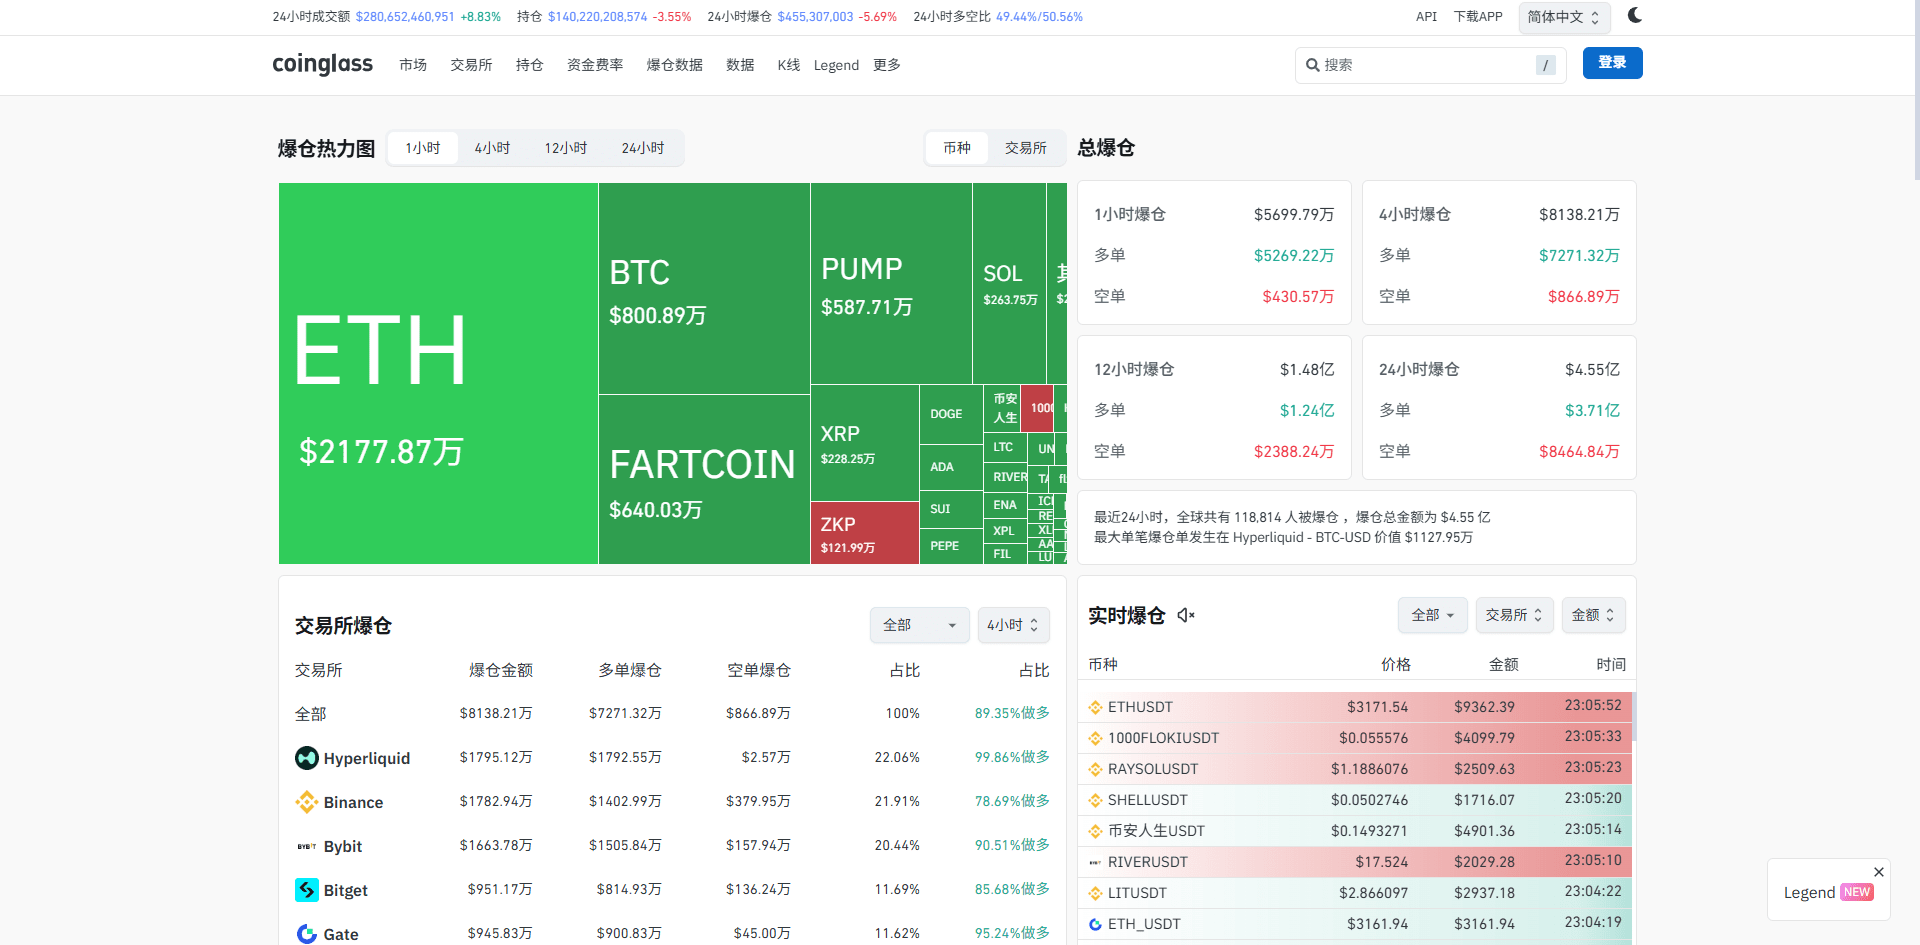
If TradingView lets you see 'price,' then CoinGlass allows you to see 'funds' and 'sentiment.'
It is an on-chain and derivatives data analysis tool. In simple terms, it allows you to see how many cards your opponents (whales and retail investors) hold.
Here are two essential data points for beginners:
Liquidation Data:
You can see how many people were liquidated for going long or short in the past hour and four hours across the network.liquidated .Usage: When the market experiences extreme declines, and the liquidation data shows only 'long liquidations' with huge amounts, it often indicates that the short selling power has been exhausted, and a short-term bottom may have appeared.
Long/Short Ratio:
It shows whether retail investors are going long or short.Usage: This is a classic 'contrarian indicator.' When the data shows that 90% of people are going long, you should be careful, as this means it's a 'crowded trade,' and the market makers may start to take profits.
Task: Open the CoinGlass website and take a look at the current 'liquidation data.' Feel it; those red and green bars behind them represent real money games.
Conclusion: To do a good job, one must first sharpen one's tools.
Alright, friends. Today, we did not discuss specific buy and sell points, but we did something more important — upgrade our equipment.
Now, with your left hand holding TradingView to see the terrain clearly, your right hand holding CoinGlass to scout the enemy, and your feet standing on the best depth exchange. Compared to those retail investors who only stare at the buy and sell buttons on exchanges, you already have a huge information advantage.
The tool itself cannot directly make you profitable, but it can help you avoid being 'blindly groping an elephant.'
Today's post-lesson interaction, I want to ask everyone to take action:
Go download or register for these two tools (TradingView and CoinGlass), search for the cryptocurrency you are most concerned about (such as BTC), and see if you can discover some information that you cannot see in the exchange's APP?
Share the new discoveries you make or problems you encounter directly in the comments section, and let's research them together!
Now that we have a handy weapon, in the next lesson, we should officially start practicing 'swordsmanship,' putting aside all complex indicators and returning to the essence of trading — candlesticks. I will teach you how to understand what candlesticks are telling you.
If this lesson has opened the door to a new world for you, please remember to like, bookmark, and follow! Don't let yourself fall behind on tools; in the next lesson, we will practice swordsmanship!
(Disclaimer: The above content is for trading knowledge sharing only and does not constitute any investment advice. All trading involves risk, and the market is highly volatile. Please proceed with caution and ensure proper risk control.)
Click to view 👉previous basic teaching and selected article content